Biology Graph Detective Challenge Game
Analyzing Data Like a Scientist Grade 11 Biology Duration: 45 minutes

Learning Goals - I Can Statements
I can identify different types of graphs used in biological research I can analyze and interpret data from various biological graphs I can determine which graph type best represents specific biological data I can explain correlations and patterns in biological datasets I can apply graph analysis skills to solve biological problems
Success Criteria
Correctly identify at least 4 different graph types Explain the purpose of each graph type with biological examples Analyze data trends and patterns accurately Match appropriate graph types to specific biological scenarios Demonstrate understanding through interactive challenges

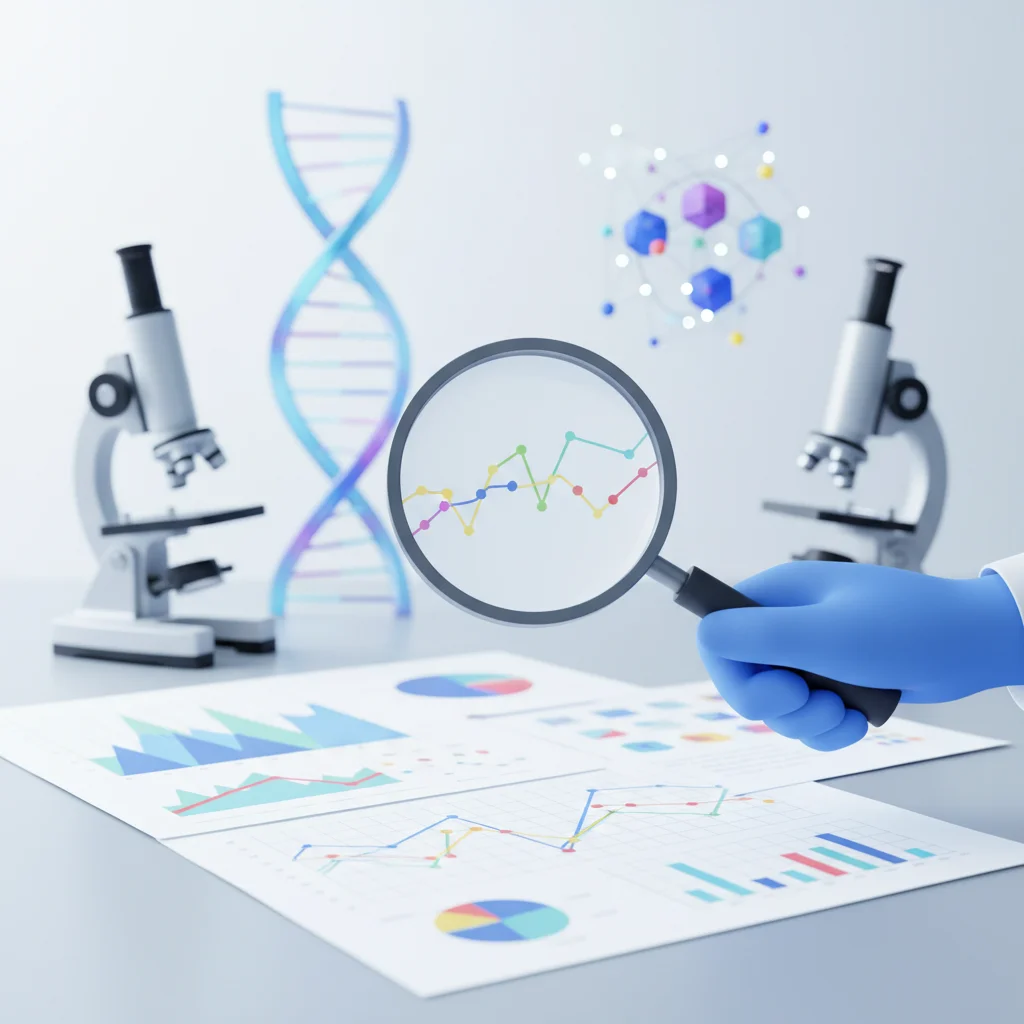
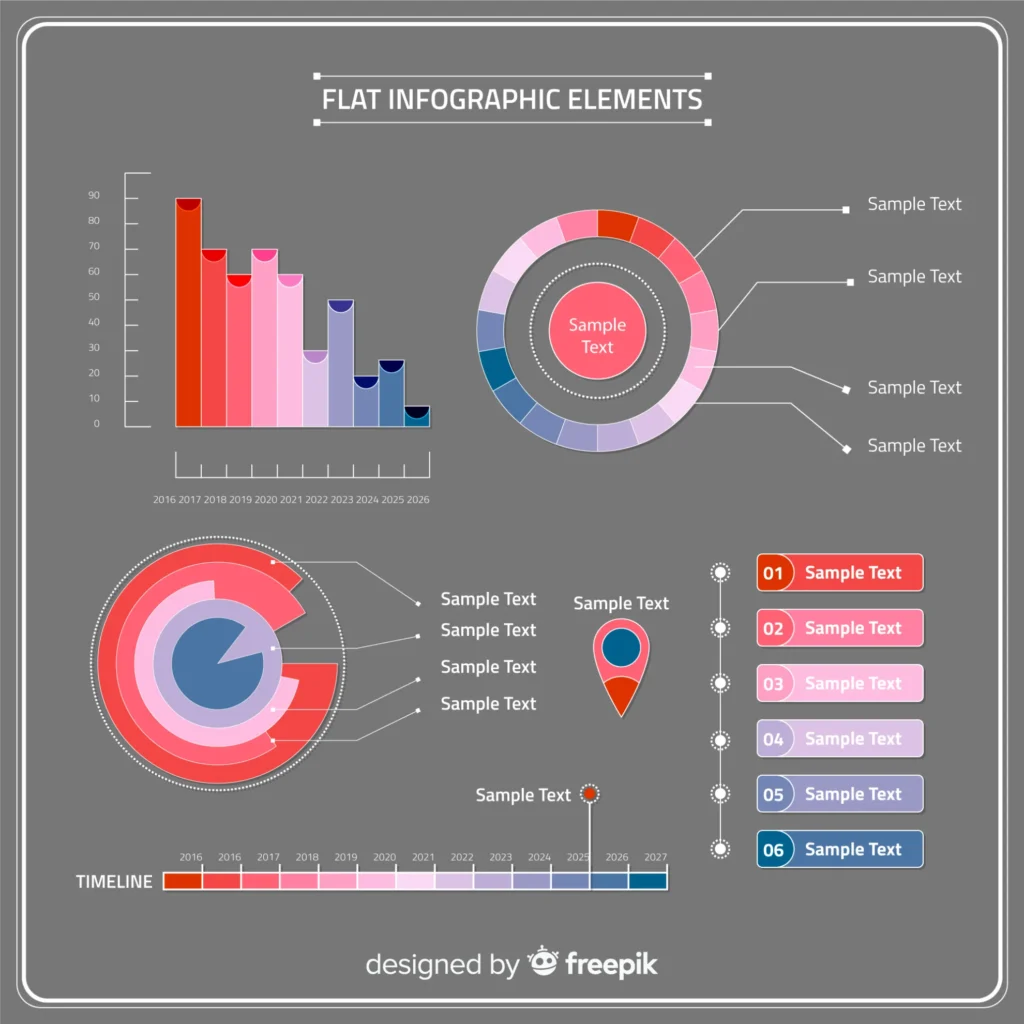
Types of Graphs in Biology
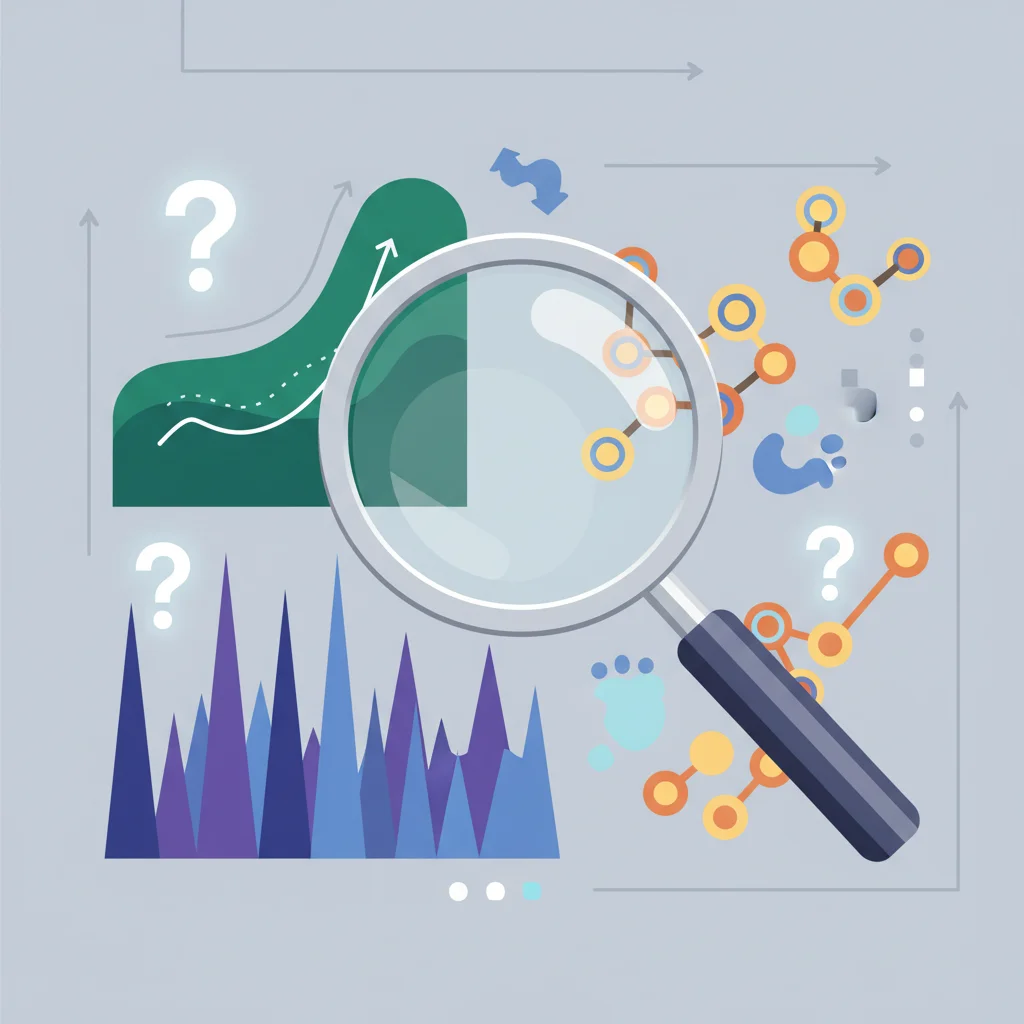
Graph Detective Challenge Round 1
Examine the mystery graphs on your worksheet Work in pairs to identify each graph type Determine what biological process each graph represents Record your detective findings
Quick Check: Graph Types
Which graph type would you use to show: The relationship between temperature and enzyme activity? Changes in a population over 50 years? The percentage of different blood types in a class?

Data Analysis Game: Correlation Hunt
{"left":"Positive Correlation: As one variable increases, the other increases (height vs shoe size)\nNegative Correlation: As one variable increases, the other decreases (altitude vs oxygen levels)","right":"No Correlation: Variables show no clear relationship (eye color vs intelligence)\nStrong vs Weak: How closely data points follow the pattern (tight cluster vs scattered)"}

Graph Matching Challenge
Match each biological scenario to the correct graph Scenarios: Population growth, enzyme efficiency, species diversity, genetic inheritance Work in teams of 3-4 students First team to correctly match all scenarios wins!
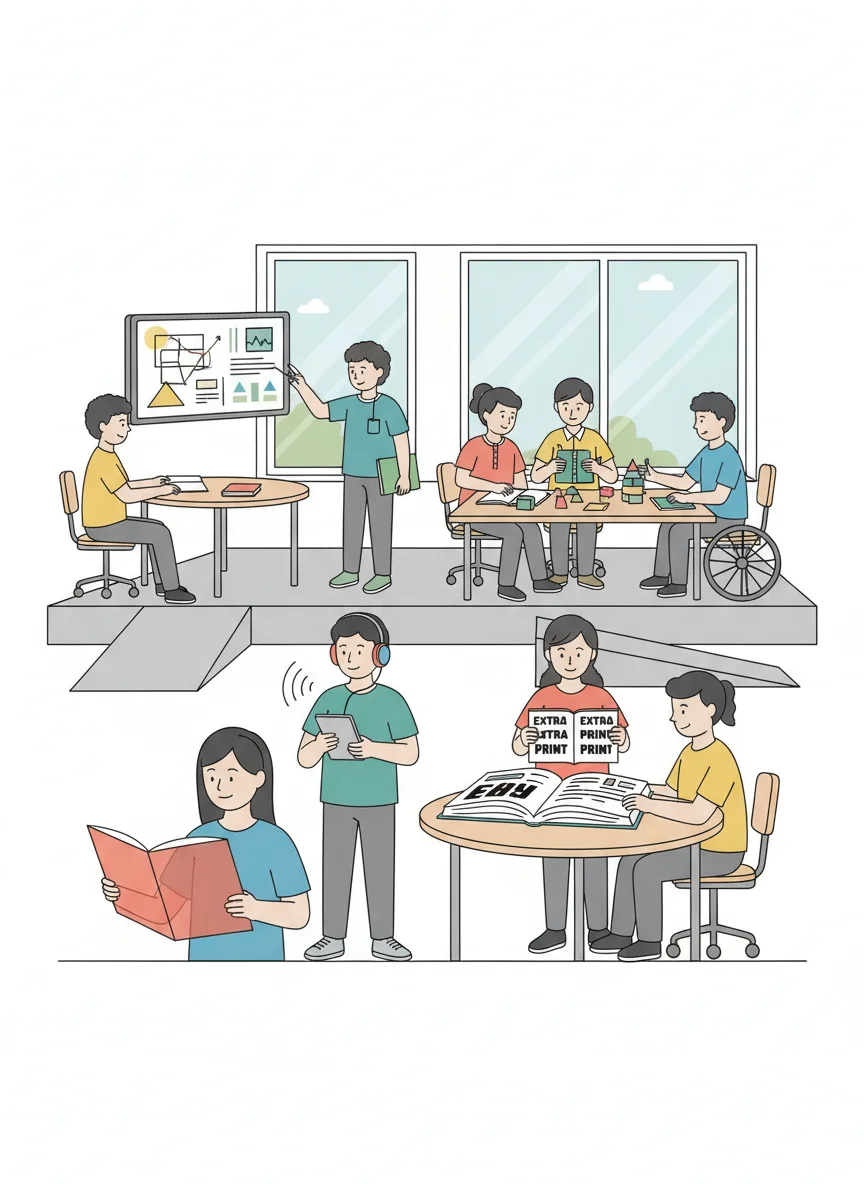
Differentiation & Extension Strategies
Dyslexia-friendly options: Use colored overlays, larger fonts, and audio descriptions Visual learners: Provide graph templates and color-coding systems Advanced students: Analyze real research data from current biological studies Support needed: Pair with stronger peers, provide step-by-step guides Extension: Create original graphs from collected classroom data

Wrap-up: You Are Now Data Detectives!
"In science, there is only physics; all the rest is stamp collecting." - But we know that organizing and analyzing biological data reveals the beautiful patterns of life!