Data Detective: Tallies and Graphs
Collecting and Organizing Information Learning to collect and organize data Making sense of information around us

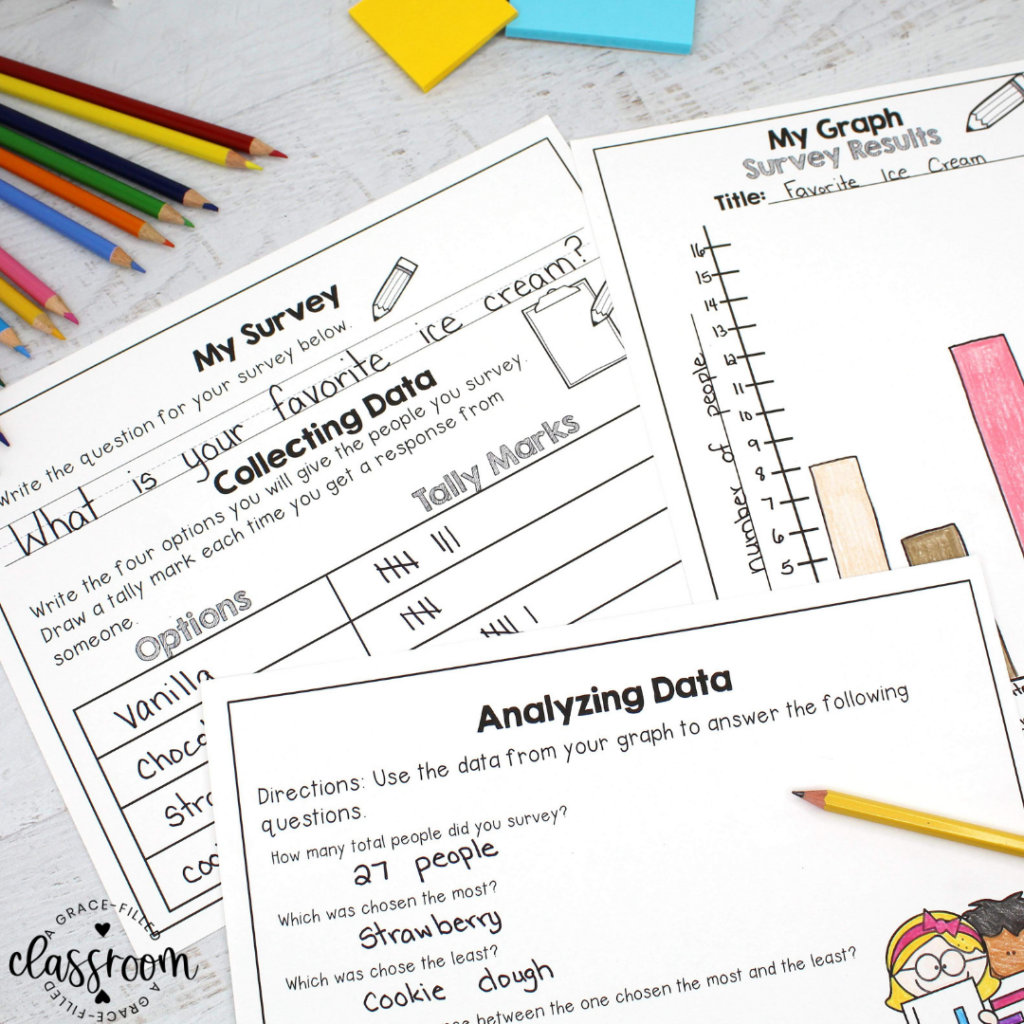
Hook: How Can You Collect Data?
Collecting and Organizing Information Learning to collect and organize data Making sense of information around us

How Can We Represent Data in Different Ways?
Collecting and Organizing Information Learning to collect and organize data Making sense of information around us

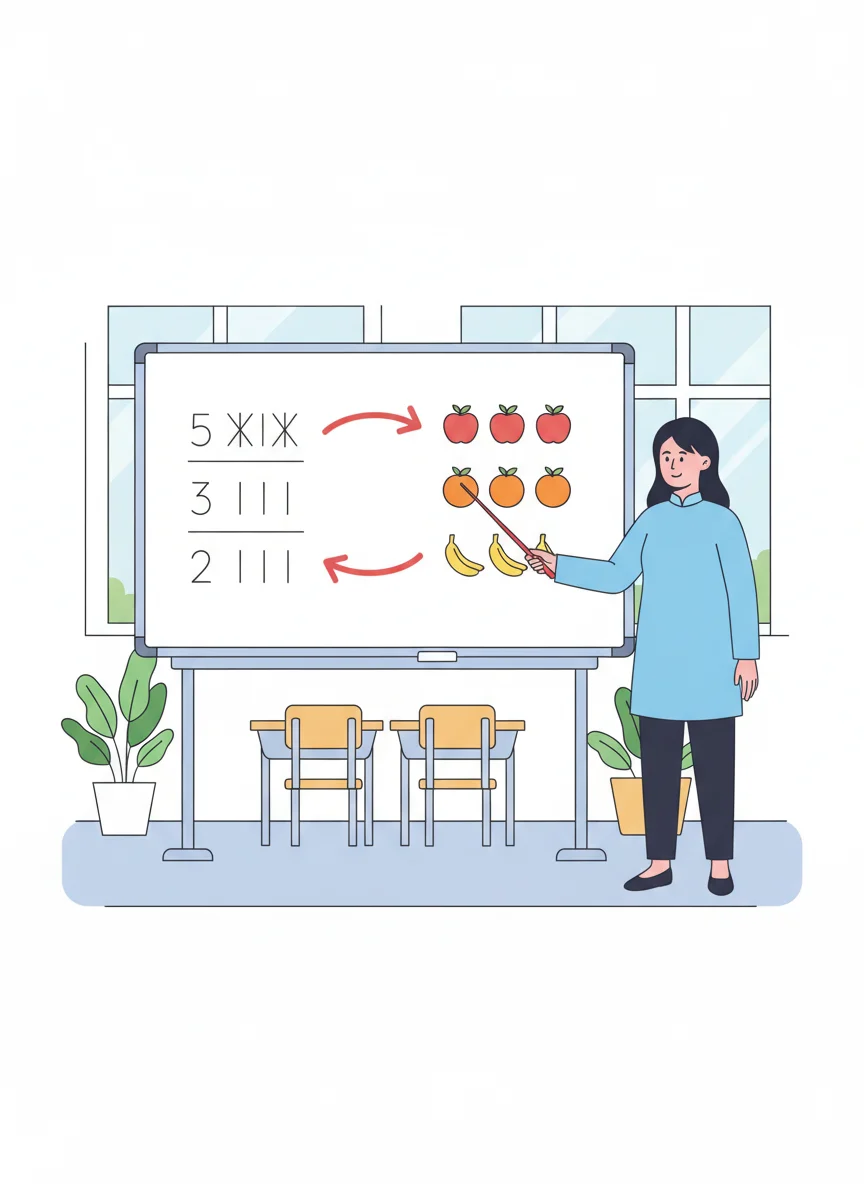
Tally Chart vs Picture Graph
{"left":"","right":"Picture Graph: Uses symbols or pictures\nEach picture represents one item\nEasy to see and compare amounts"}
Answer: How Are They Related?
Each tally mark = one picture Both show the same information Both help us count and compare The data stays the same, just looks different
Which Is Easier to Interpret and Why?
Look at both graphs Which one helps you understand the data better? What makes it easier to read?

Parts of Graphs
Title - tells what the graph is about Labels - show what we're counting Key - explains what pictures mean Data - the information we collected
Hook: Become a Data Detective!
Every good detective needs clues to solve mysteries. Today, we'll use tallies and graphs as our clues to solve data mysteries!
Learning Objectives
Content Objective: I can create and read tally charts and picture graphs Language Objective: I can explain what data shows using math vocabulary Success Criteria: I can organize data, create graphs, and answer questions about them

Think It, Talk It, Write It, Prove It
Think It: Look at the data quietly Talk It: Share ideas with your partner Write It: Record your observations Prove It: Show your evidence from the graph

Turn and Talk Activity
Question: What's your favorite way to show data - tallies or pictures? Turn to your partner Share your choice and explain why Listen to your partner's idea too

Content Vocabulary
Data: Information we collect and organize Tally Chart: Uses marks to count things Tally Mark: A line that shows one count Picture Graph: Uses pictures to show data
5 more slides available after you open the deck.
Download all 17 slides