Exploring Linear Relationships Through Real Contexts
Grade 8 Mathematics Building Understanding Through Concrete, Representational, and Abstract Models 60-Minute Session

Learning Objectives
Understand linear relationships through contextual problem-solving Represent linear patterns using tables, graphs, and equations Use multiple strategies to interpret mathematical patterns Engage in mathematical discourse and justify reasoning
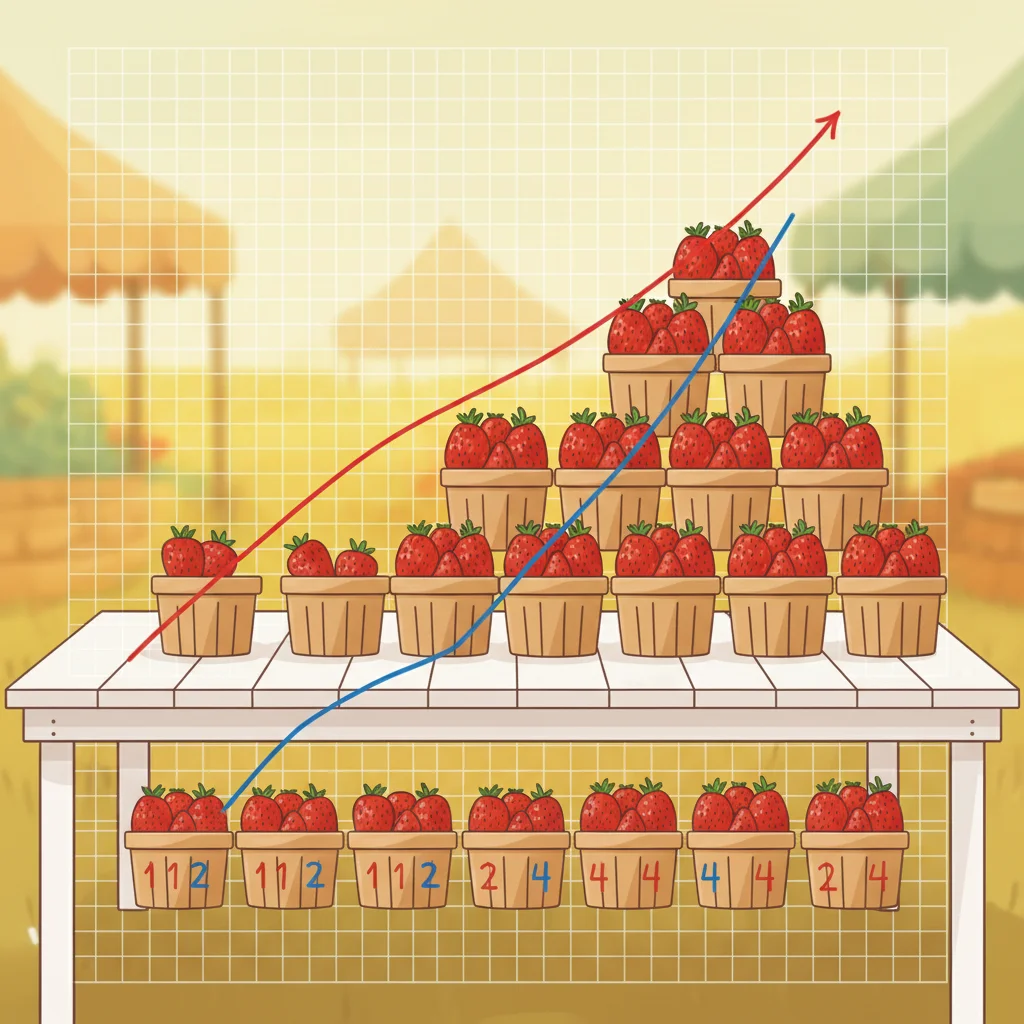
The Strawberry Farmer Problem
A local farmer sells baskets of strawberries Day 1: She sells 3 baskets Each day after: She sells 2 more baskets than the previous day Challenge: How many baskets does she sell after several days?

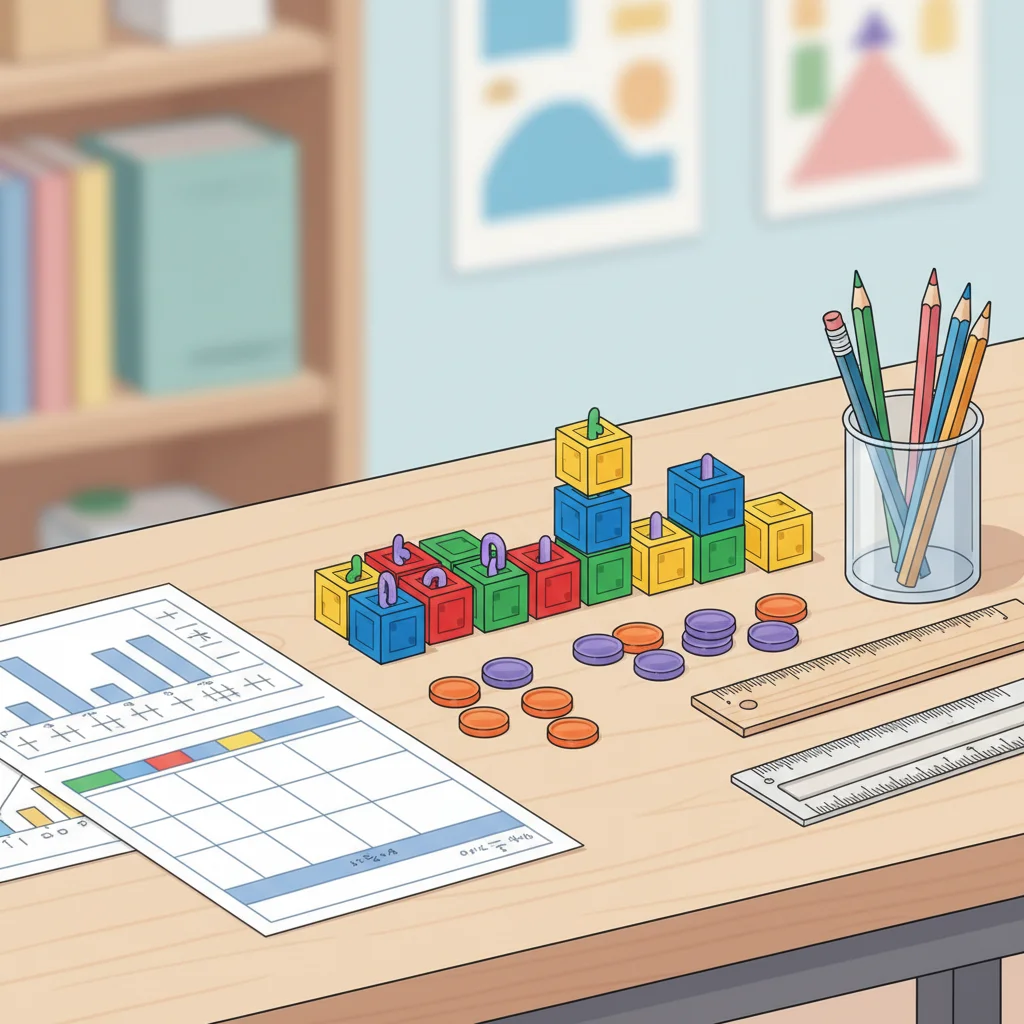
Concrete Exploration Phase
Use counters to model baskets sold each day Fill in the data table based on your physical model Day 1: 3 baskets, Day 2: ?, Day 3: ?, Day 4: ?, Day 5: ? Predict: How many baskets on Day 6?

Visual Representation Phase
Plot points on a coordinate graph: (Day, Baskets) Connect your table data to visual patterns Describe what you notice about the graph How does this relate to your physical model?
Connecting Representations
{"left":"Physical Model: Counters show +2 pattern each day\nTable: Shows numerical relationship clearly","right":"Graph: Visual display of linear relationship\nPattern: Constant rate of change = 2 baskets per day"}

Moving to Abstract Thinking
What mathematical rule describes the number of baskets sold on any day d? How can you write this rule as an equation? Why does your equation fit the table and graph you created?

Reflection and Next Steps
Linear relationships appear in many real-world contexts Multiple representations help us understand patterns Equations are powerful tools for making predictions Mathematical discourse deepens our understanding