Grade 3 Bar and Picture Graphs
Learning to Read and Create Graphs 60-Minute Math Lesson Grade 3 Mathematics

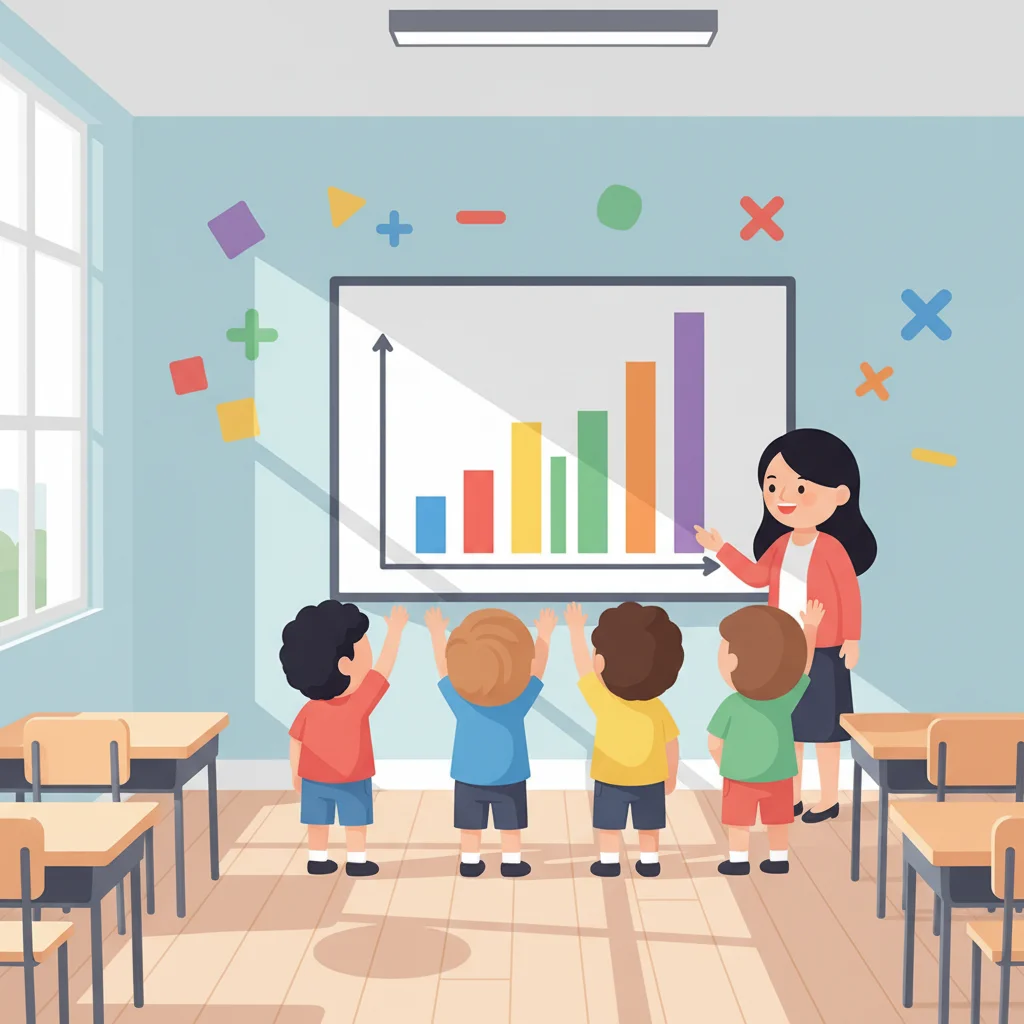
What is a Graph?
Think about it: Where have you seen graphs before? What do you think graphs help us do? Can you name any types of graphs?
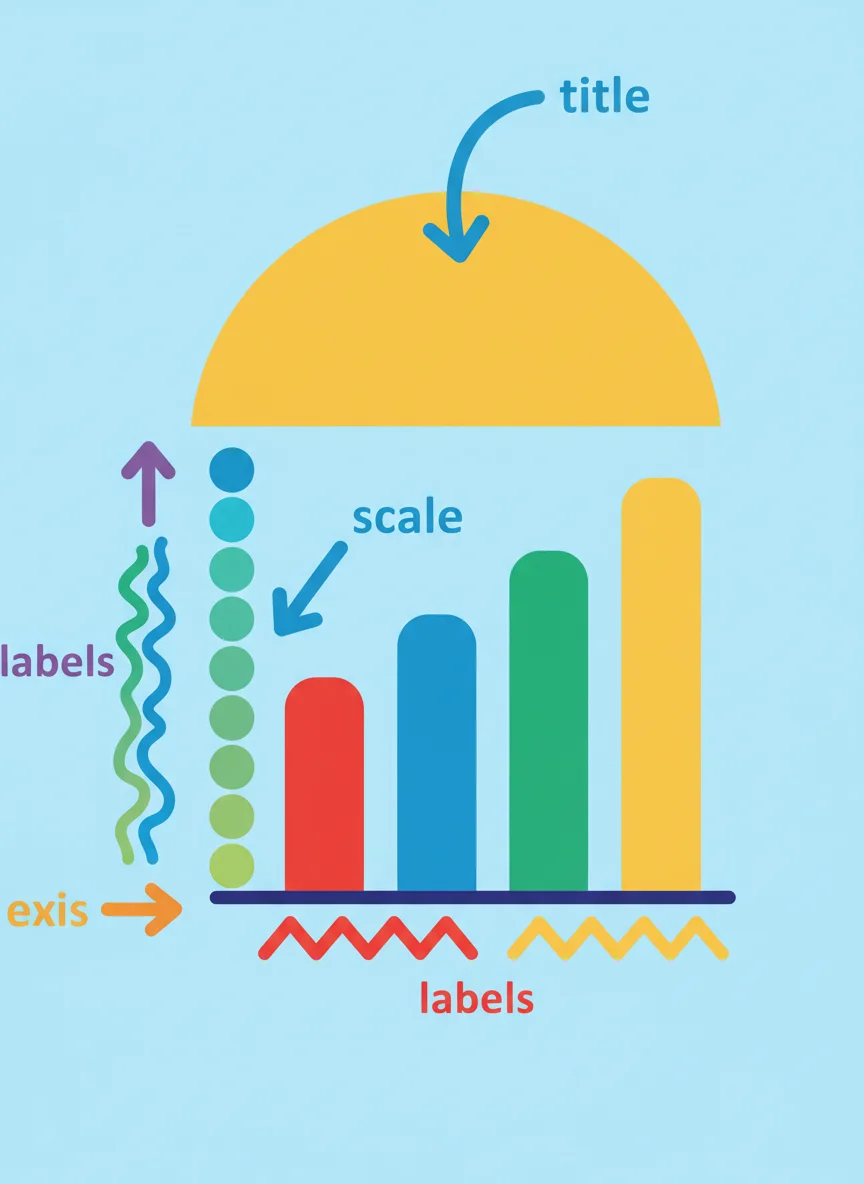
What Makes a Good Graph?
Every graph needs a TITLE Clear LABELS for categories Easy-to-read SCALE or symbols Organized DATA that tells a story
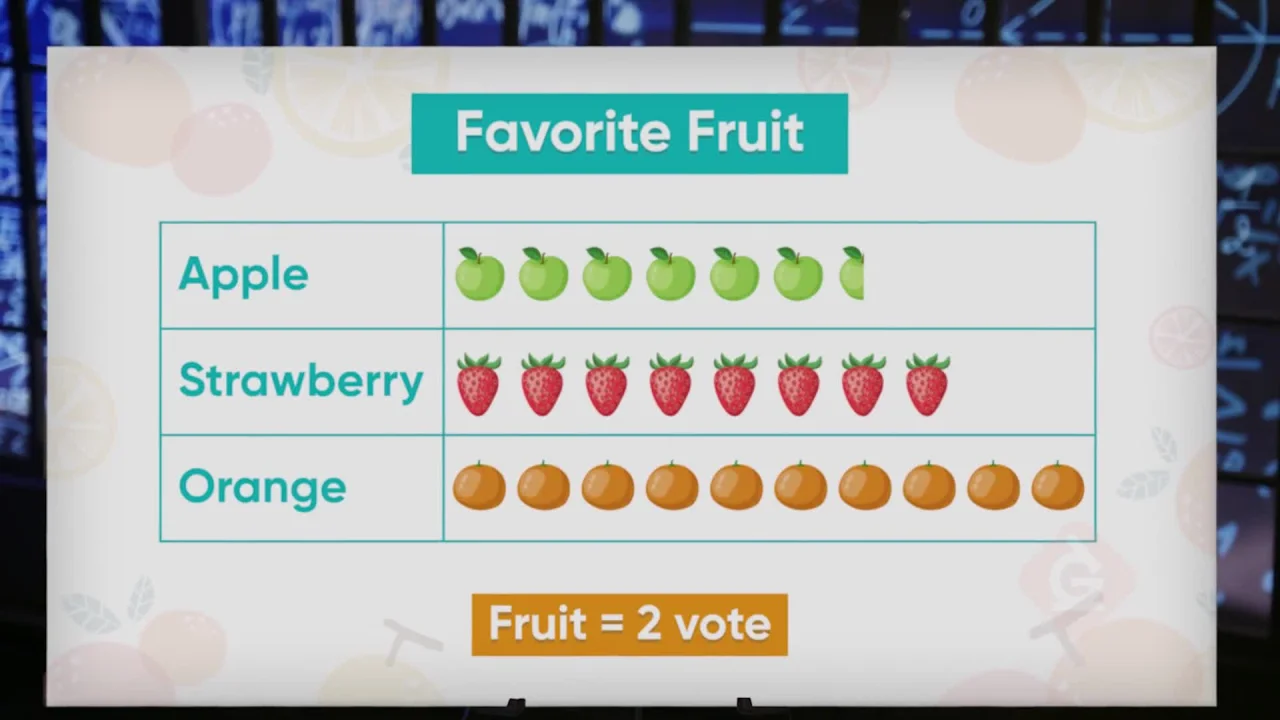
Picture Graphs vs Bar Graphs

Reading Our Class Pet Graph
Look at this bar graph showing pets owned by students How many students have dogs? Which pet is most popular? How many more students have cats than fish?
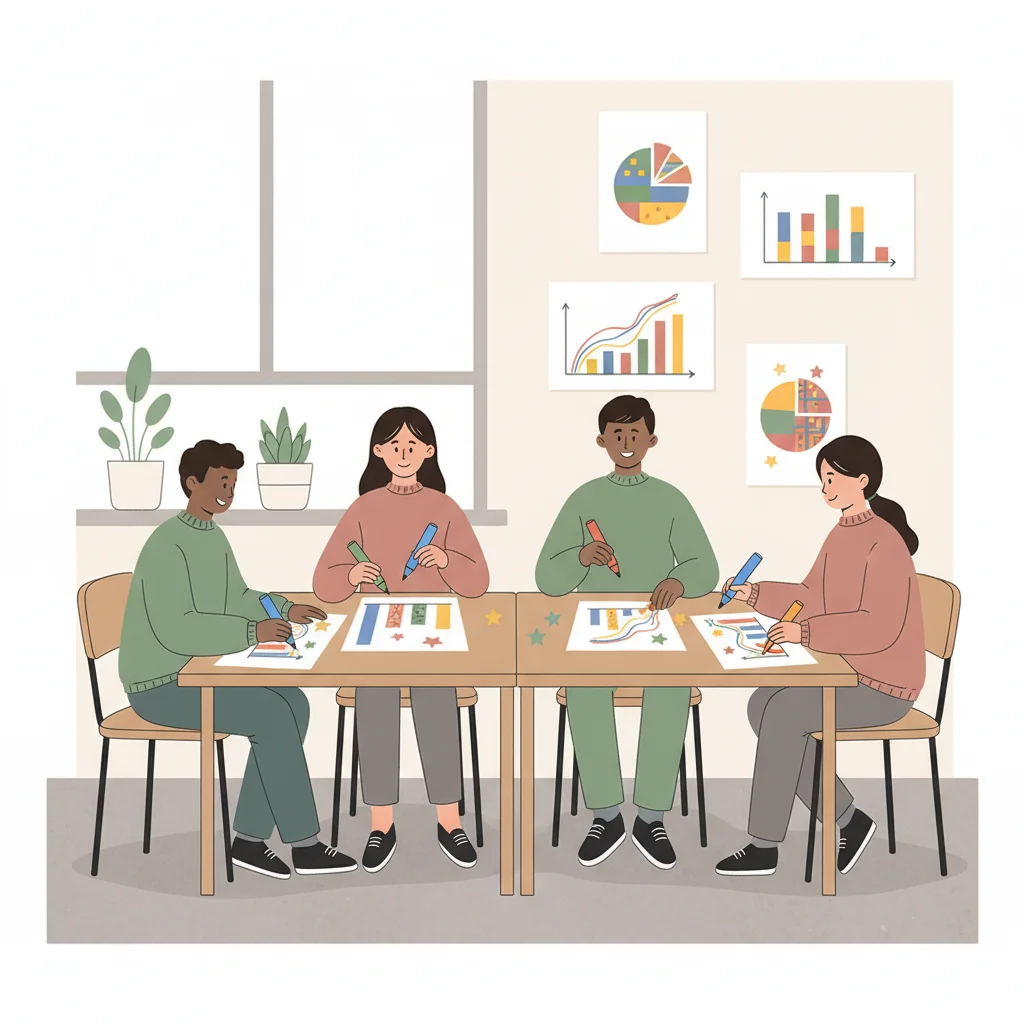
Let's Create Graphs Together!
{"left":"Picture Graph: Use symbols to show data\nEach symbol = a specific number\nDraw symbols in neat rows\nDon't forget the title and labels","right":"Bar Graph: Use bars to show data\nMake bars the right height\nUse a clear scale\nColor-code for easy reading"}
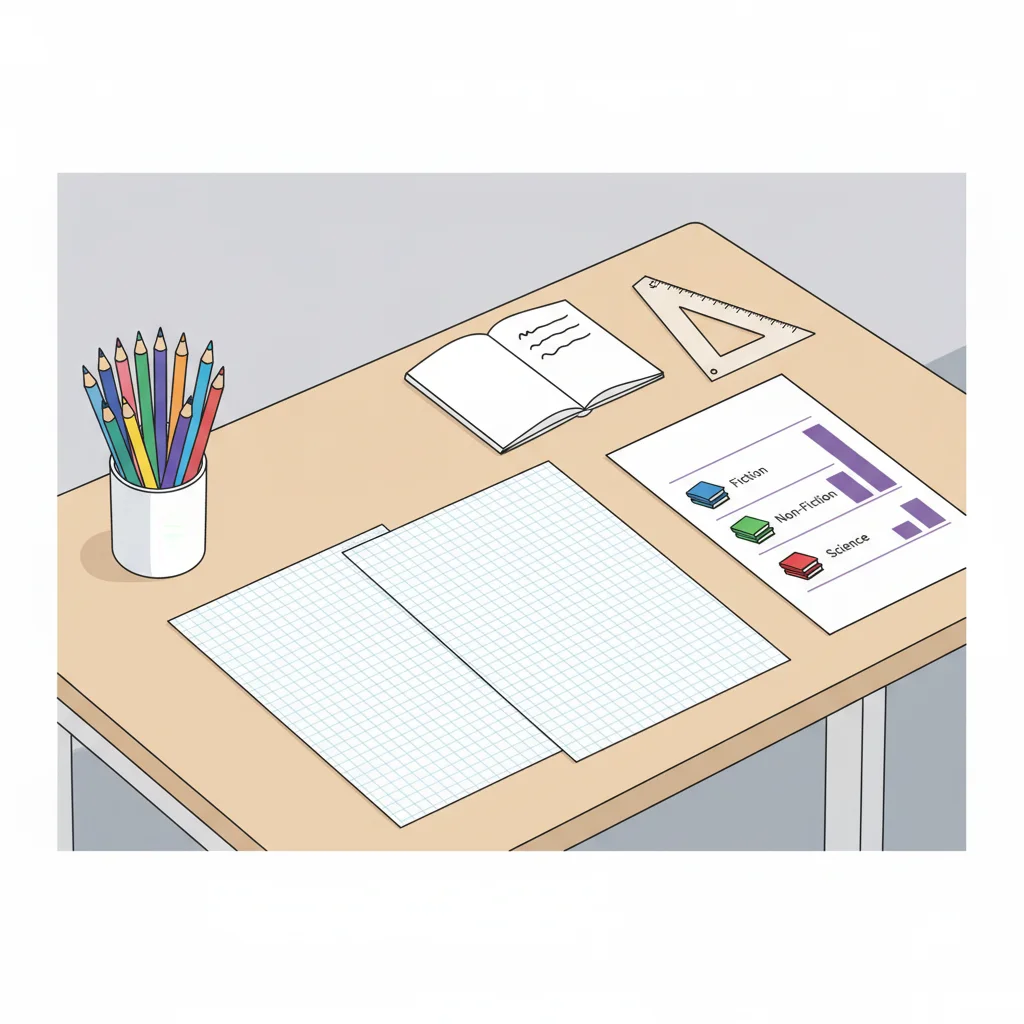
Your Turn: Books We Read
Create your own picture graph AND bar graph Data: Fantasy-8 books, Mystery-4 books, Science-6 books, Sports-3 books Choose: What will each symbol represent? Remember: Title, labels, and neat organization!
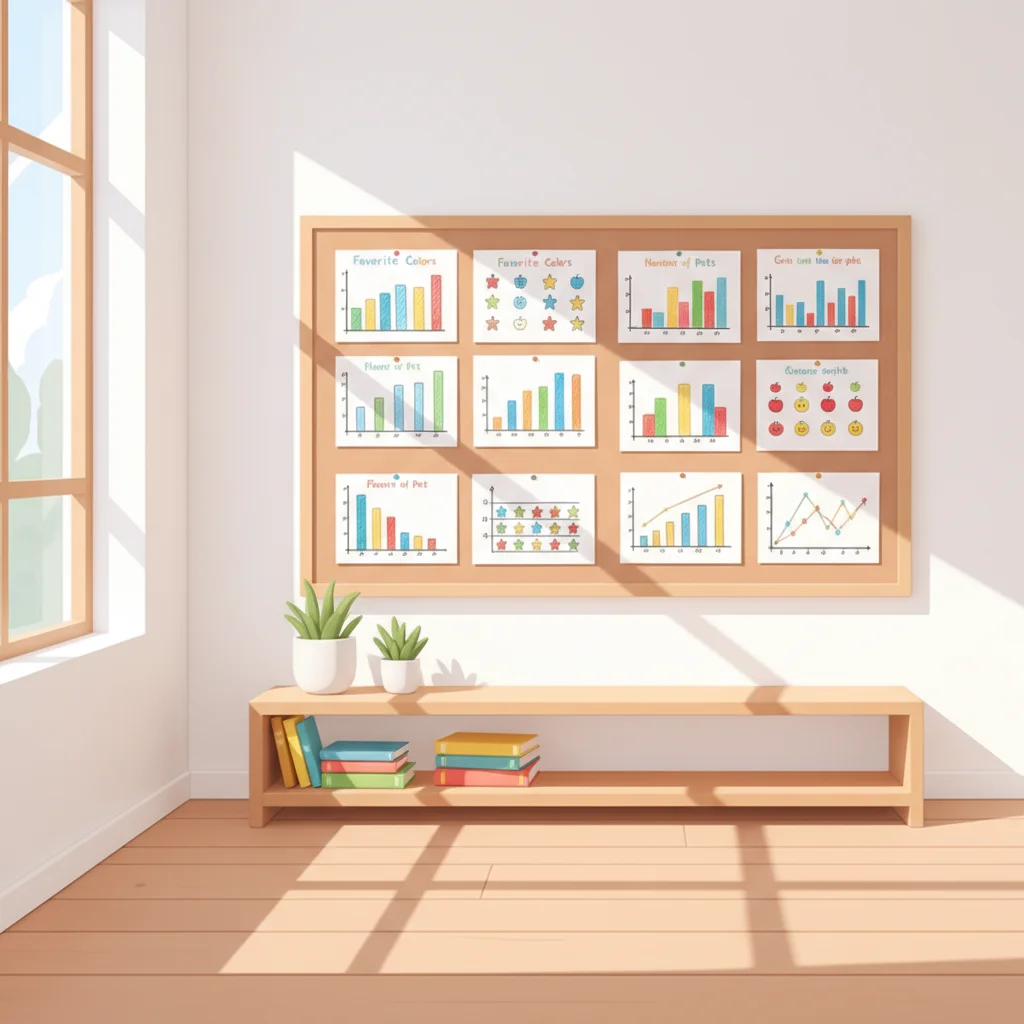
Graphs Help Us See Patterns!
'Graphs turn numbers into pictures that tell stories about our world.'