Graphing Proportional Relationships and Rates
Grade 8 Mathematics Understanding Unit Rates and Slopes 60-Minute Lesson
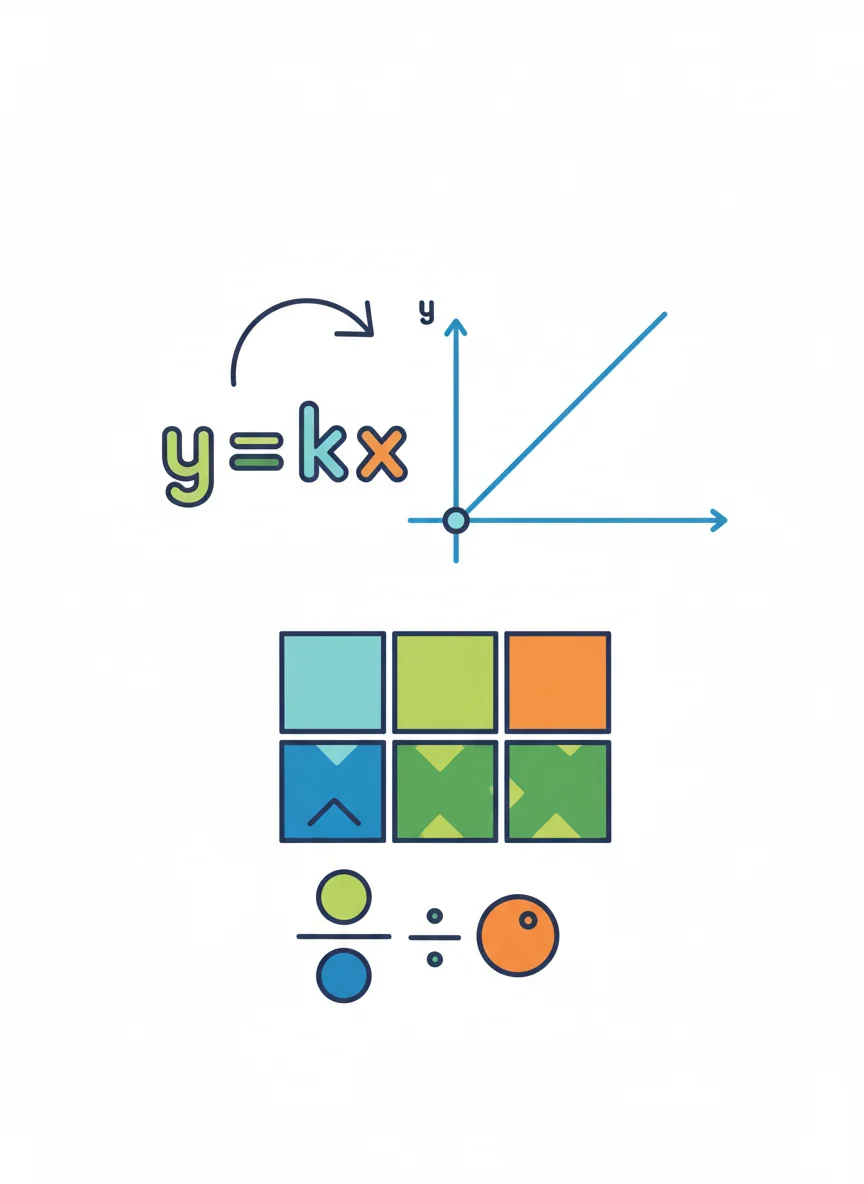
What Are Proportional Relationships?
A relationship where y is always a constant k times x Written as y = kx (where k is the constant of proportionality) The graph is always a straight line through the origin The constant k represents the unit rate or slope
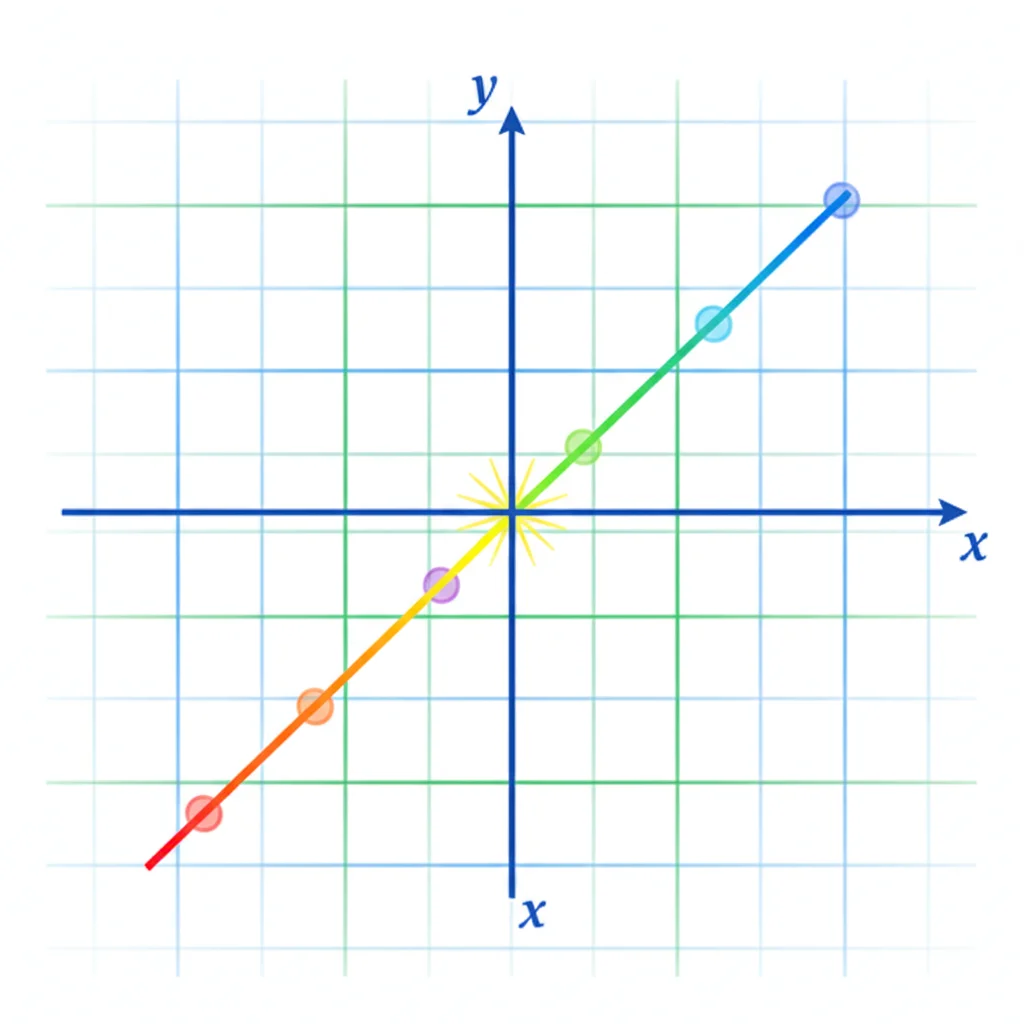
Notice & Wonder: Priya's Jogging Speed
Look at the graph showing Priya's distance over time What do you notice about the pattern? What do you wonder about her speed? Share your observations with a partner
Representing Proportional Relationships
{"left":"Tables show constant ratios between variables\nGraphs show straight lines through the origin","right":"Equations use the form y = kx\nDiagrams help visualize the relationship"}
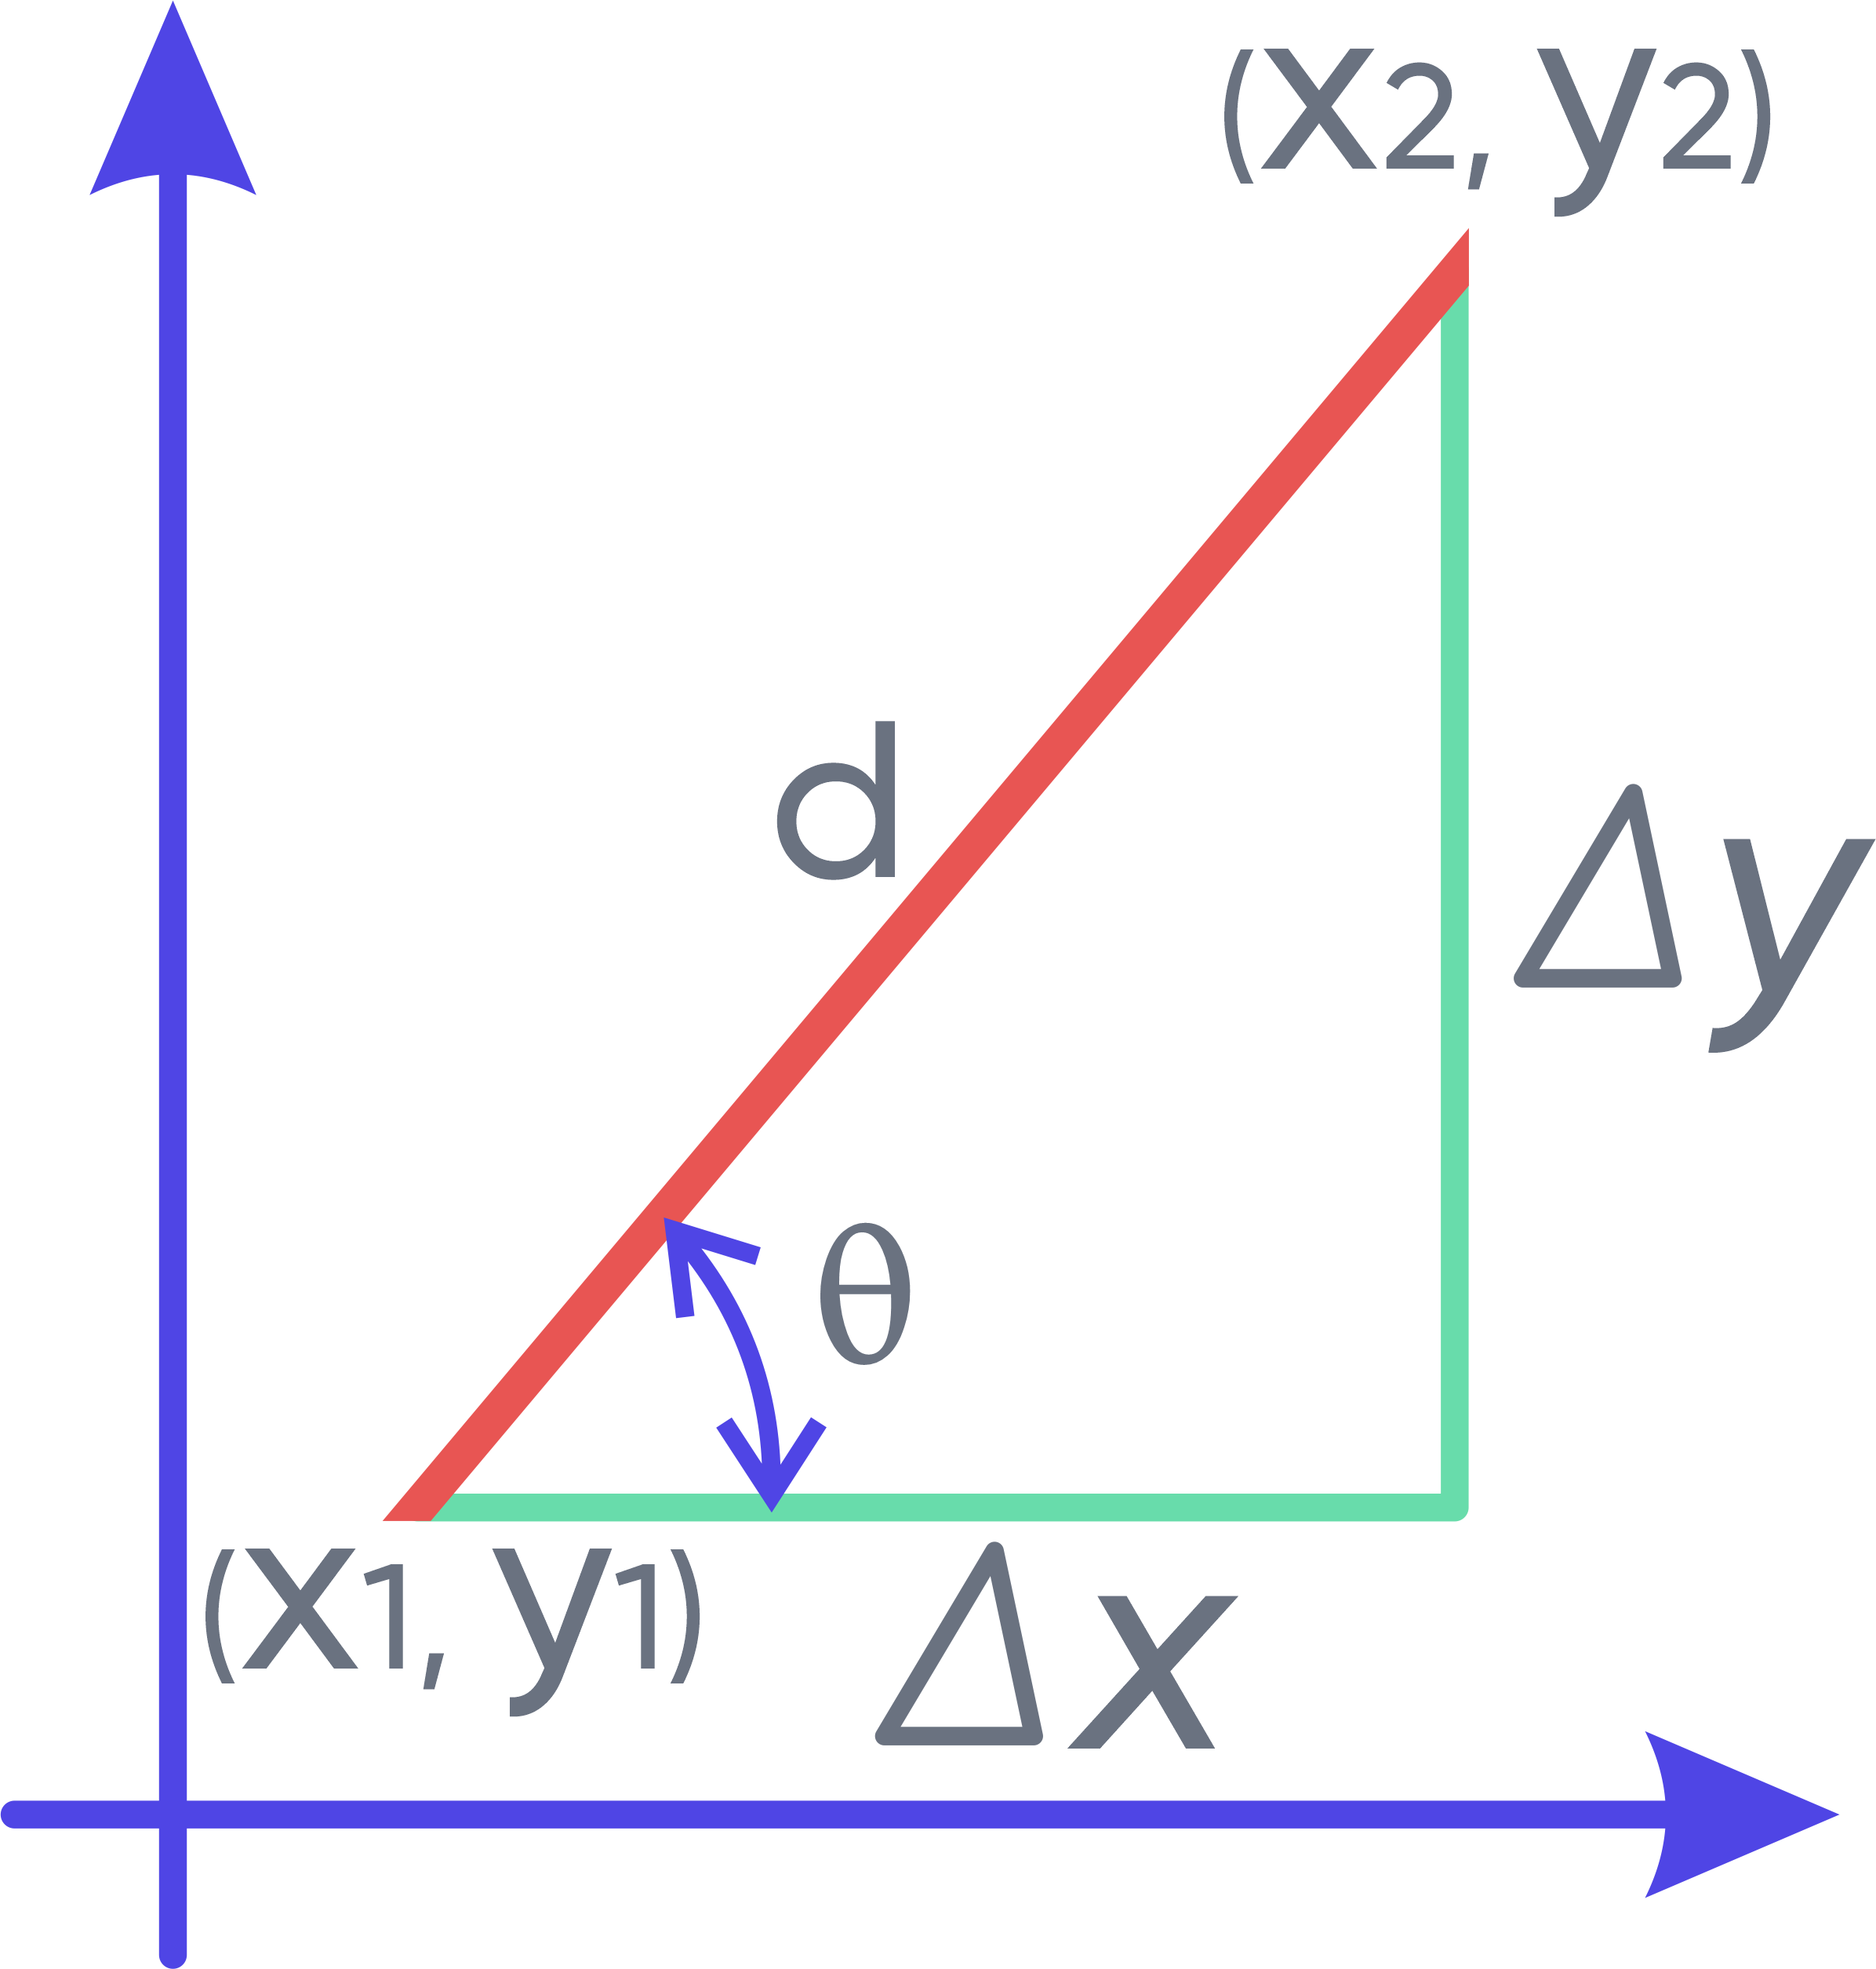
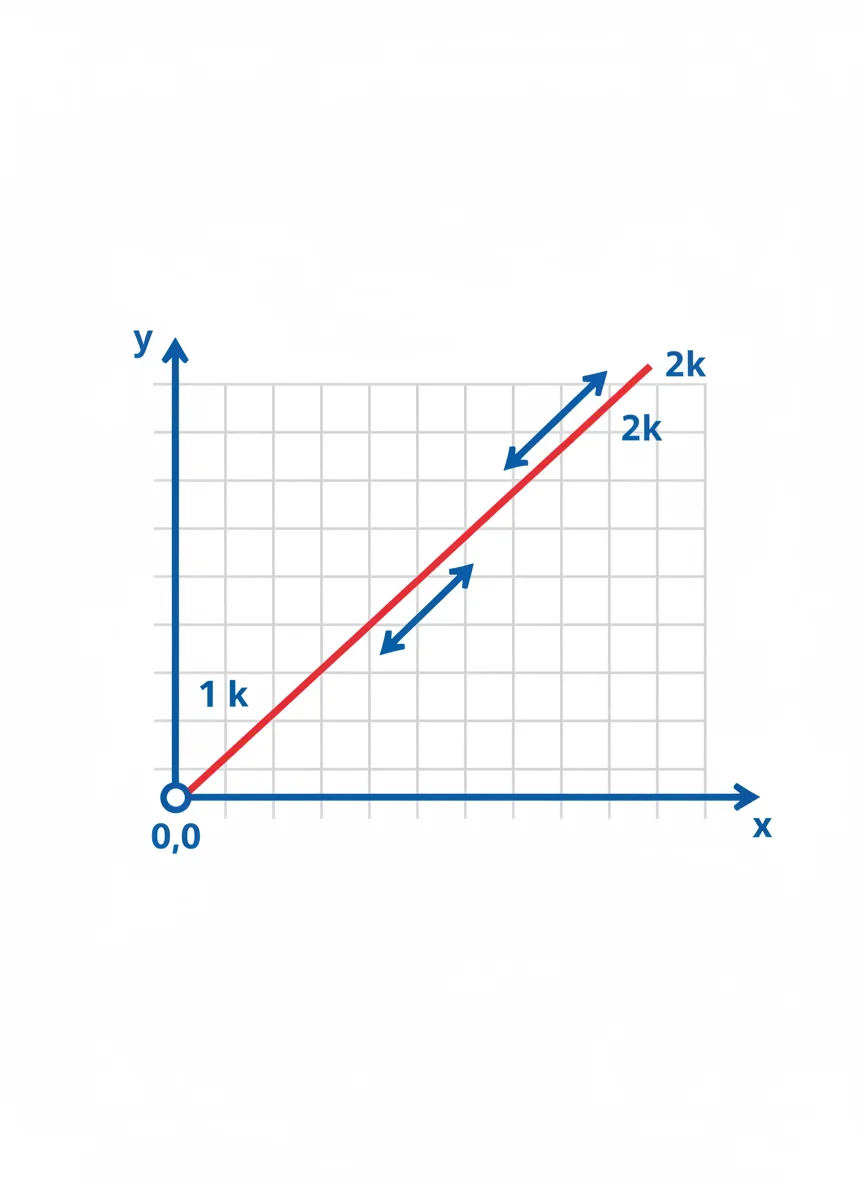
Finding the Constant of Proportionality
The constant k in y = kx is the unit rate It tells us how much y changes for each unit of x On a graph, k is the slope of the line Example: If y = 3x, then k = 3 (3 units of y per 1 unit of x)

Practice Problem: Blueberry Farm
A farm sells 5 lbs of blueberries for $24 Write an equation for cost (c) based on pounds (p) Graph the relationship Find the cost for 8 pounds
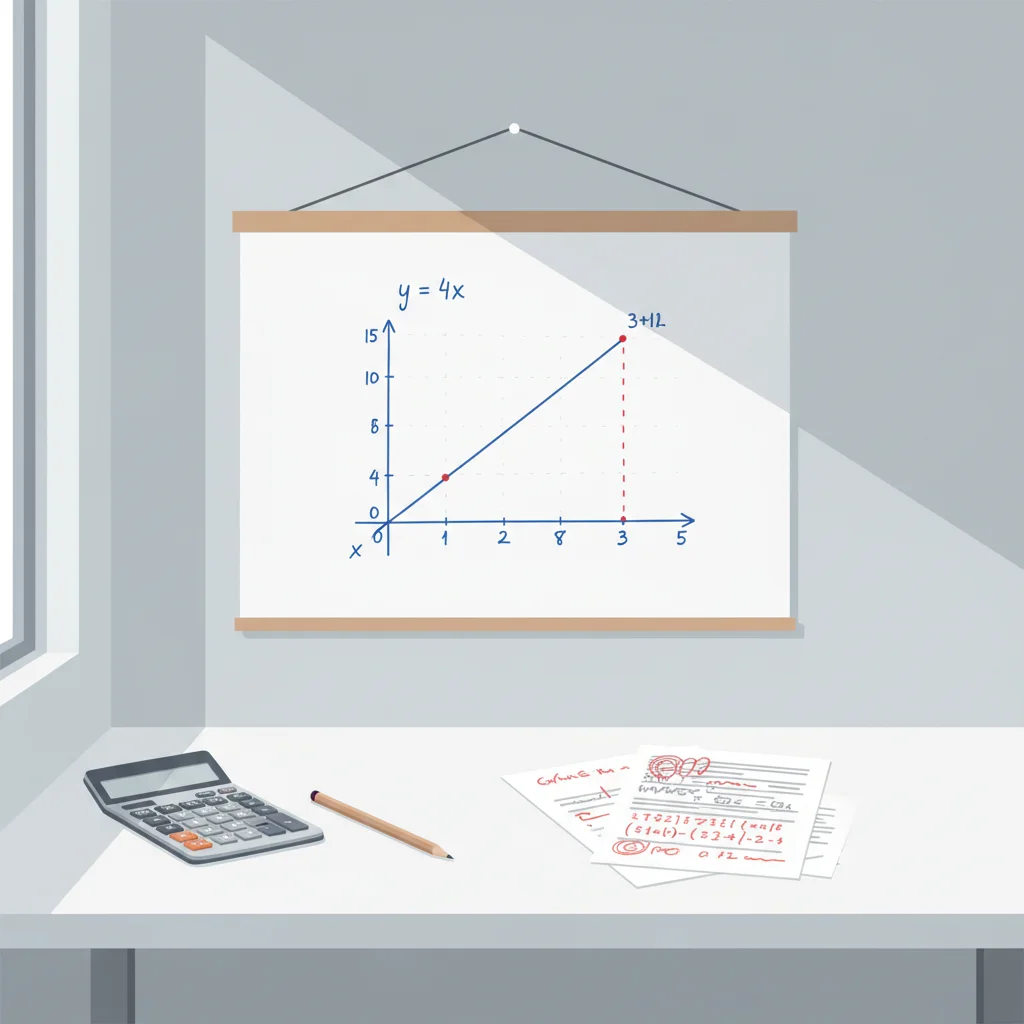
Error Analysis Challenge
Given: y = 4x A student claims point (3, 11) lies on this line Is the student correct? Explain your reasoning step by step
Key Takeaways
Proportional relationships have the form y = kx The graph is always a straight line through the origin The constant k represents both unit rate and slope Multiple representations (tables, graphs, equations) show the same relationship