Graphing Proportional Relationships and Slopes
Grade 8 Mathematics Understanding Unit Rates and Constant Proportionality 60-Minute Lesson
Warm-Up: Notice & Wonder
Look at Priya's jogging graph Observe Diego's biking graph (twice as fast) What do you notice about the patterns? What questions do you have about their speeds?
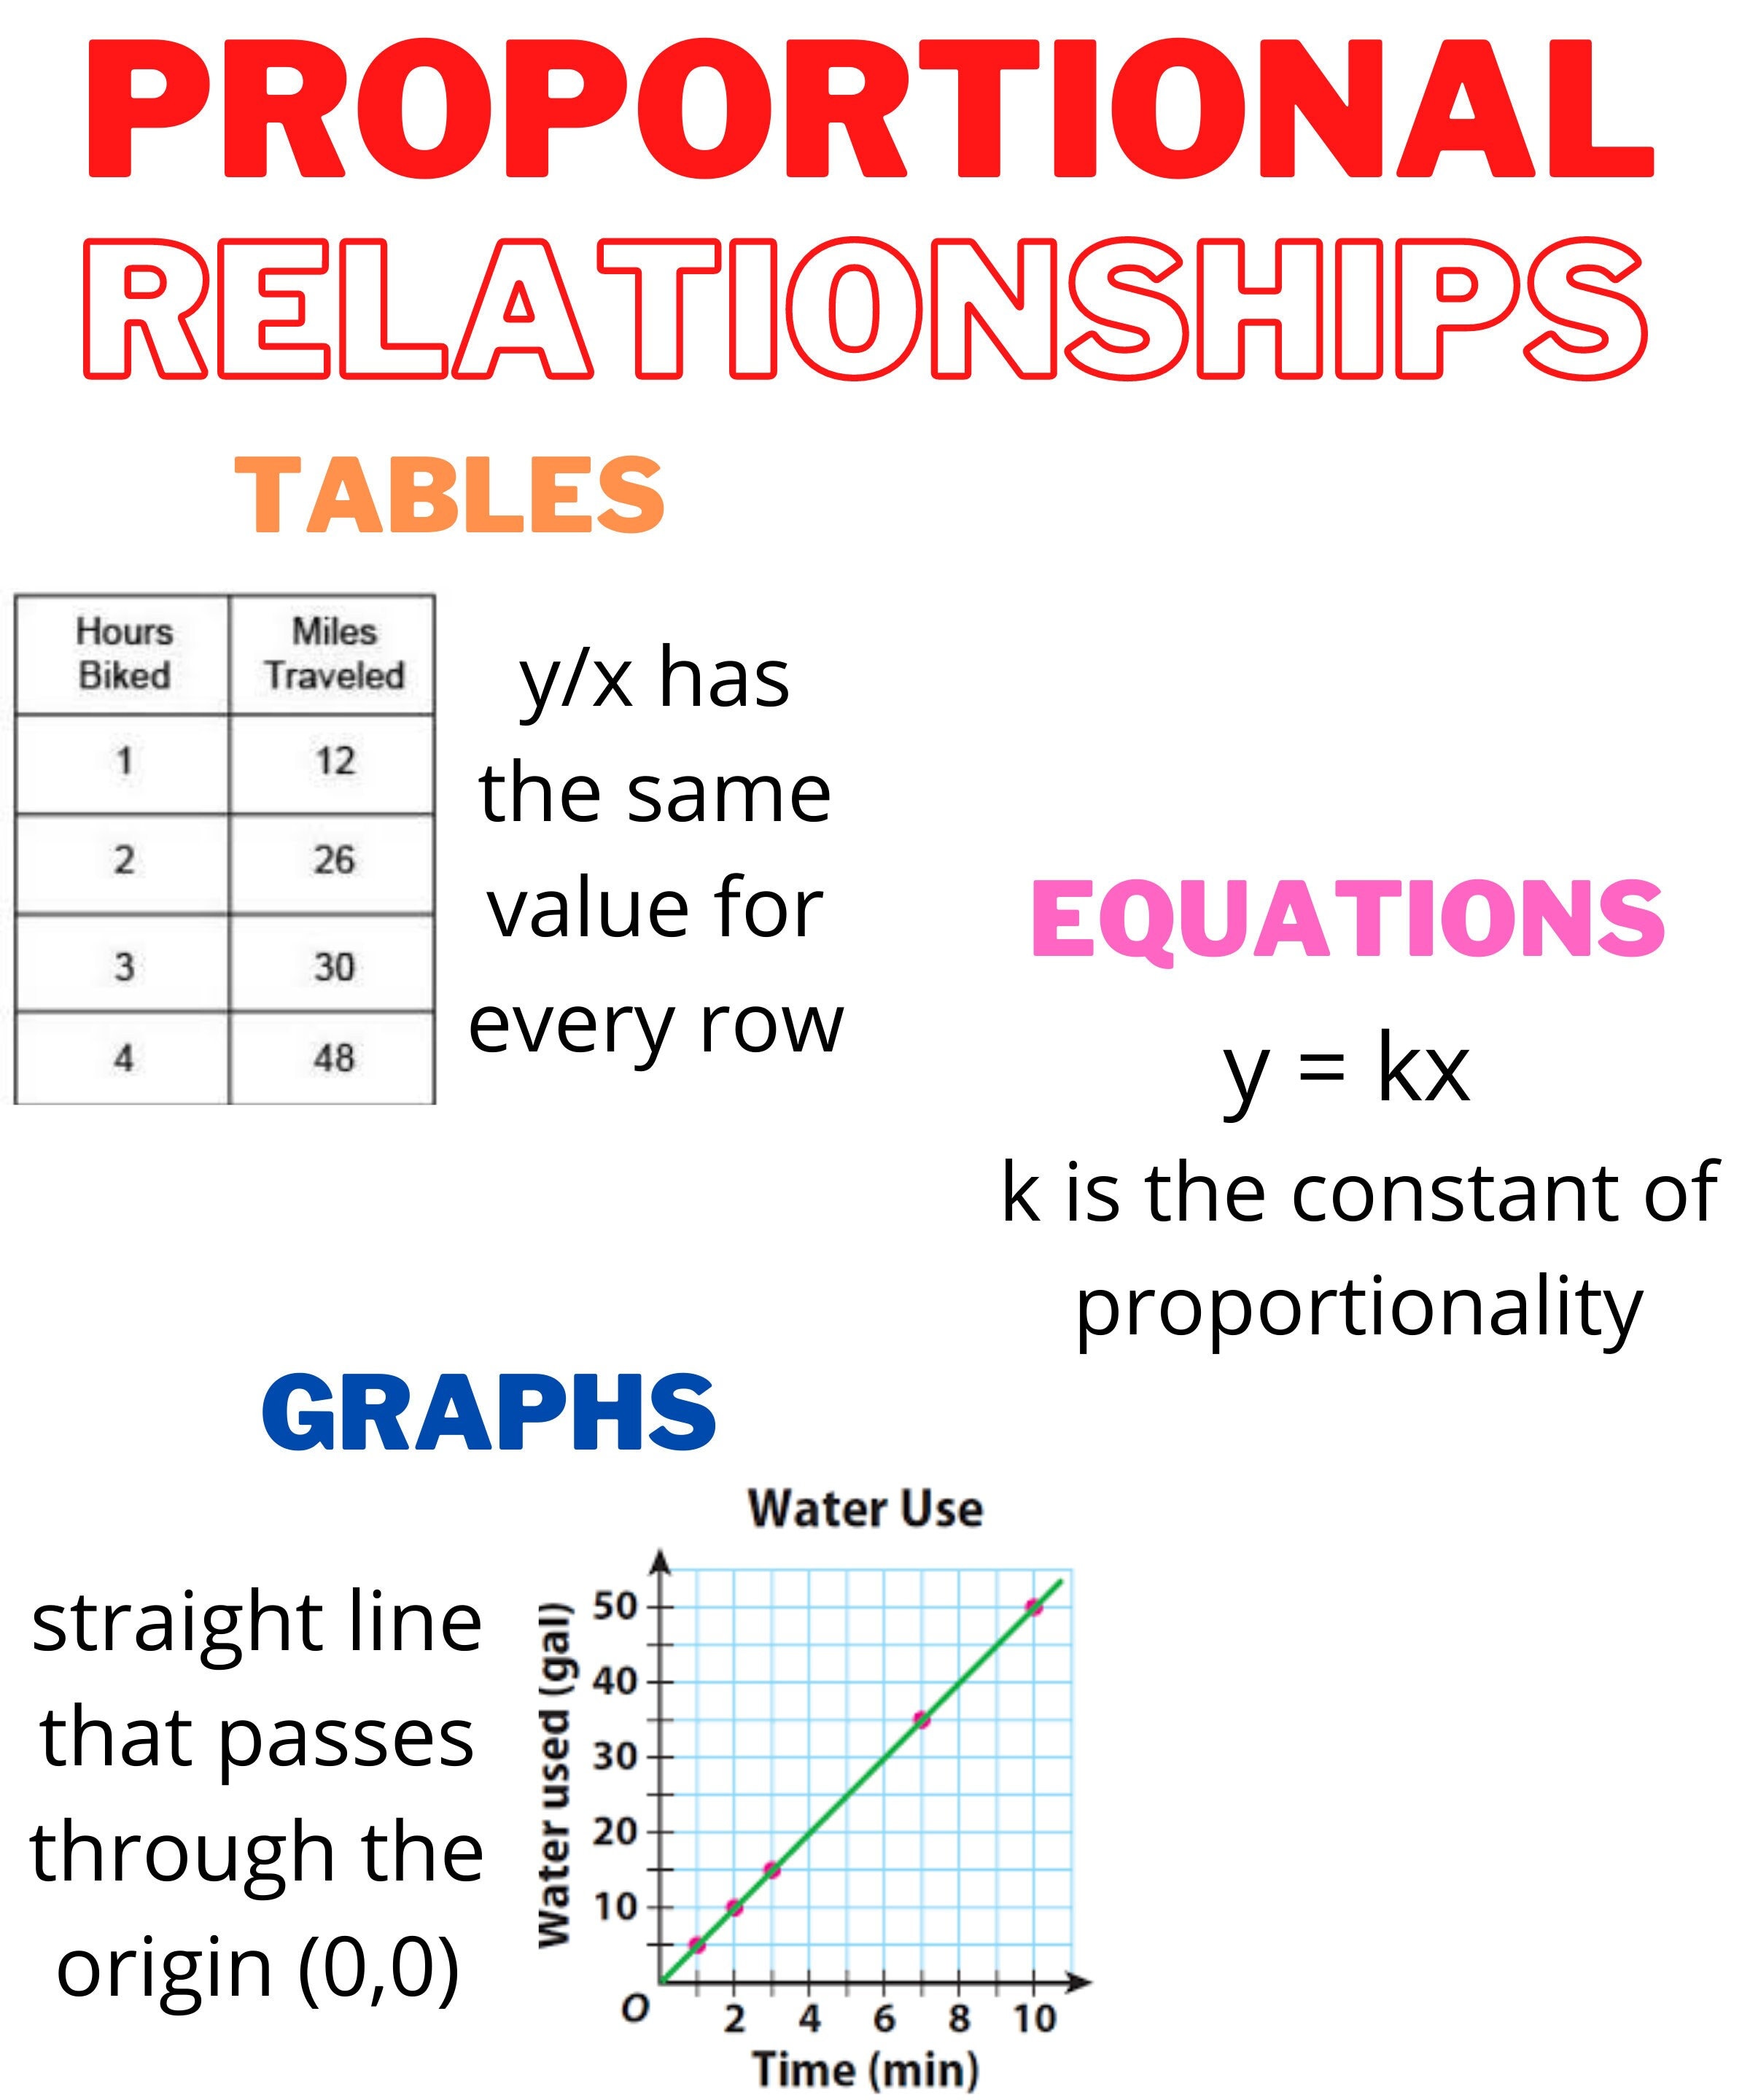
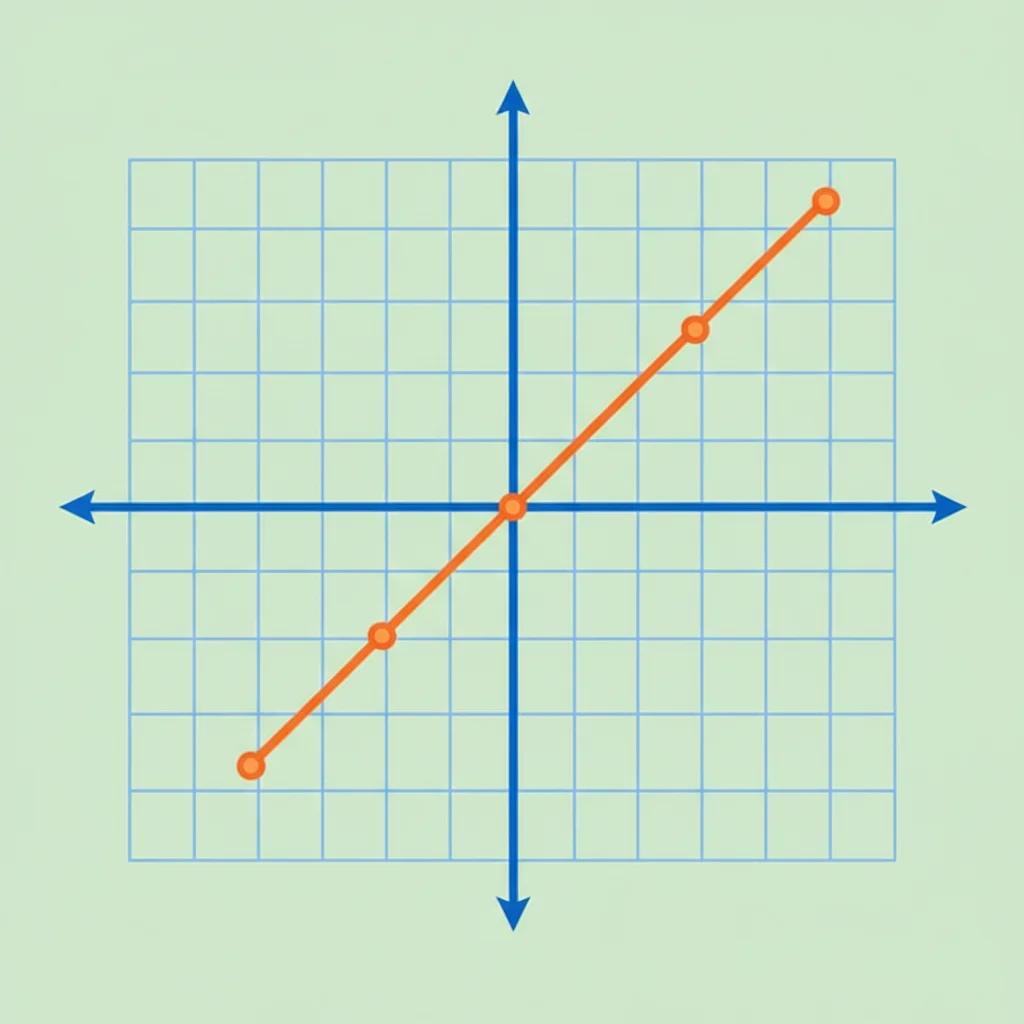
What Makes a Relationship Proportional?
The graph is a straight line through the origin (0,0) The ratio y/x stays constant for all points Can be written as y = kx where k is the constant The constant k represents the unit rate

Multiple Ways to Show Proportional Relationships
{"left":"Tables with consistent ratios\nGraphs as straight lines through origin","right":"Equations in the form y = kx\nReal-world contexts with constant rates"}
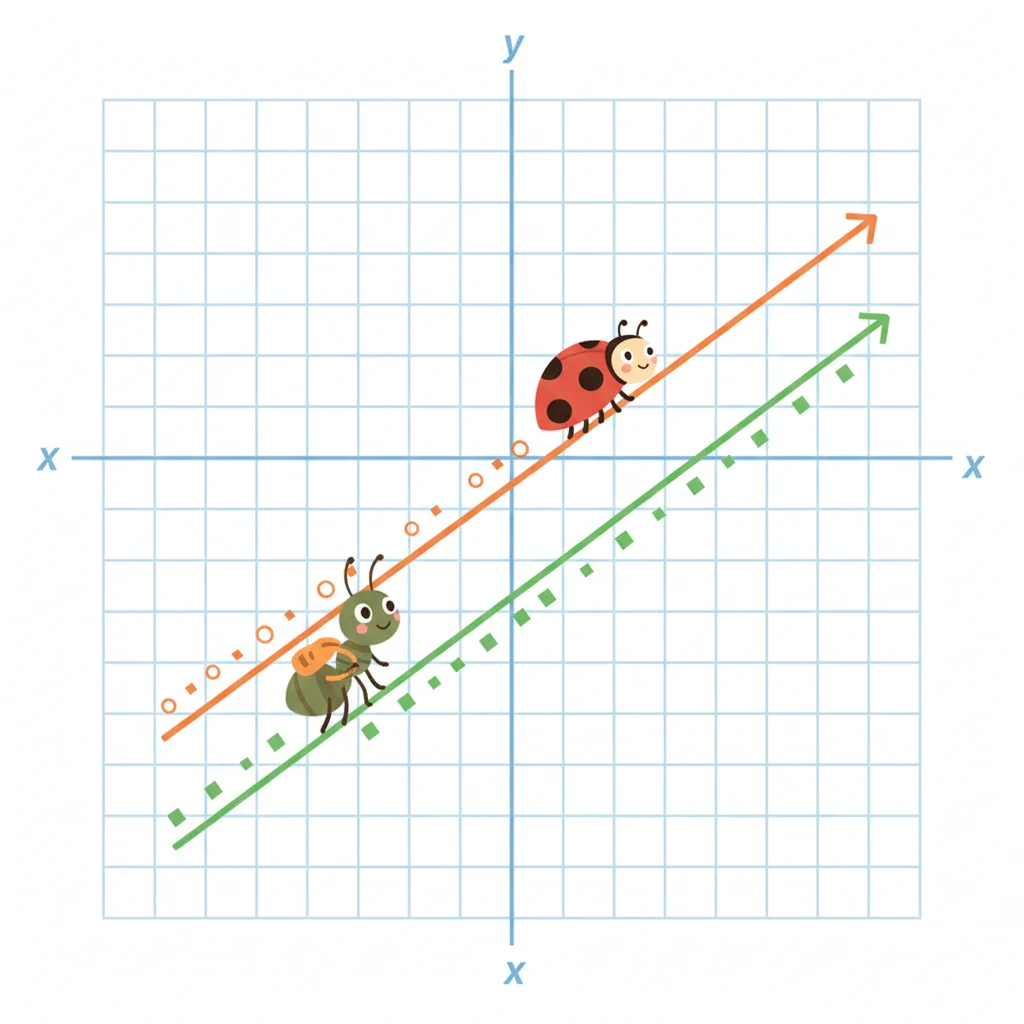
Bug Race Investigation
Create a table for ladybug and ant speeds Plot points on coordinate plane Draw lines for each bug's journey Compare their rates of travel

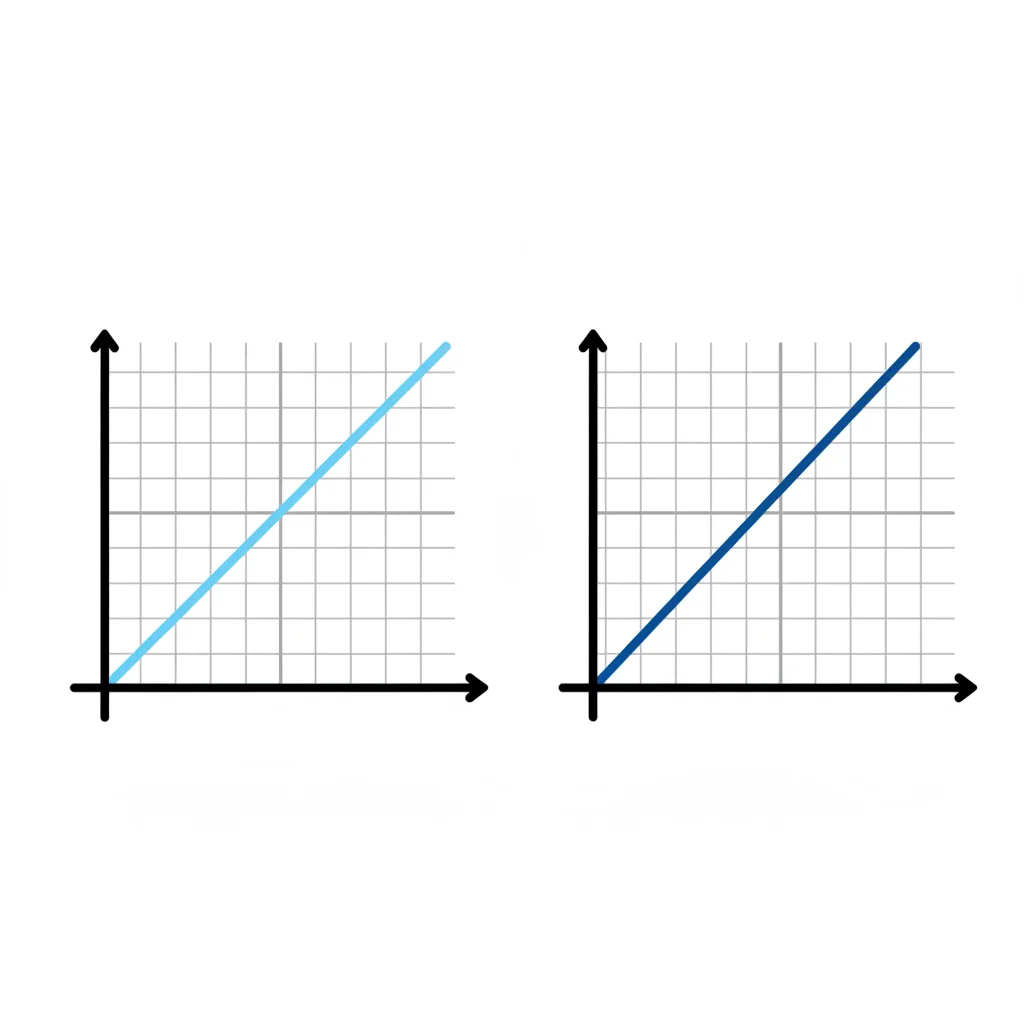
The Slope Connection
Slope = rise/run between any two points In proportional relationships, slope = constant of proportionality Steeper slopes mean faster rates The slope tells us the unit rate

Error Analysis Challenge
Given: y = 4x Student claims point (3, 11) is on this line Is the student correct? Show your work and explain your reasoning
Key Takeaways
Proportional relationships graph as straight lines through the origin The constant of proportionality equals the slope of the line We can compare rates by comparing slopes Multiple representations help us understand the same relationship