Theoretical Probability: Predicting Mathematical Outcomes
Grade 7 Mathematics Understanding probability before experiments Making predictions using mathematical reasoning
What is Theoretical Probability?
The likelihood of an event happening based on mathematical reasoning Calculated WITHOUT doing experiments Uses the formula: P(event) = favorable outcomes ÷ total possible outcomes Helps us make predictions before testing
The Basic Probability Formula
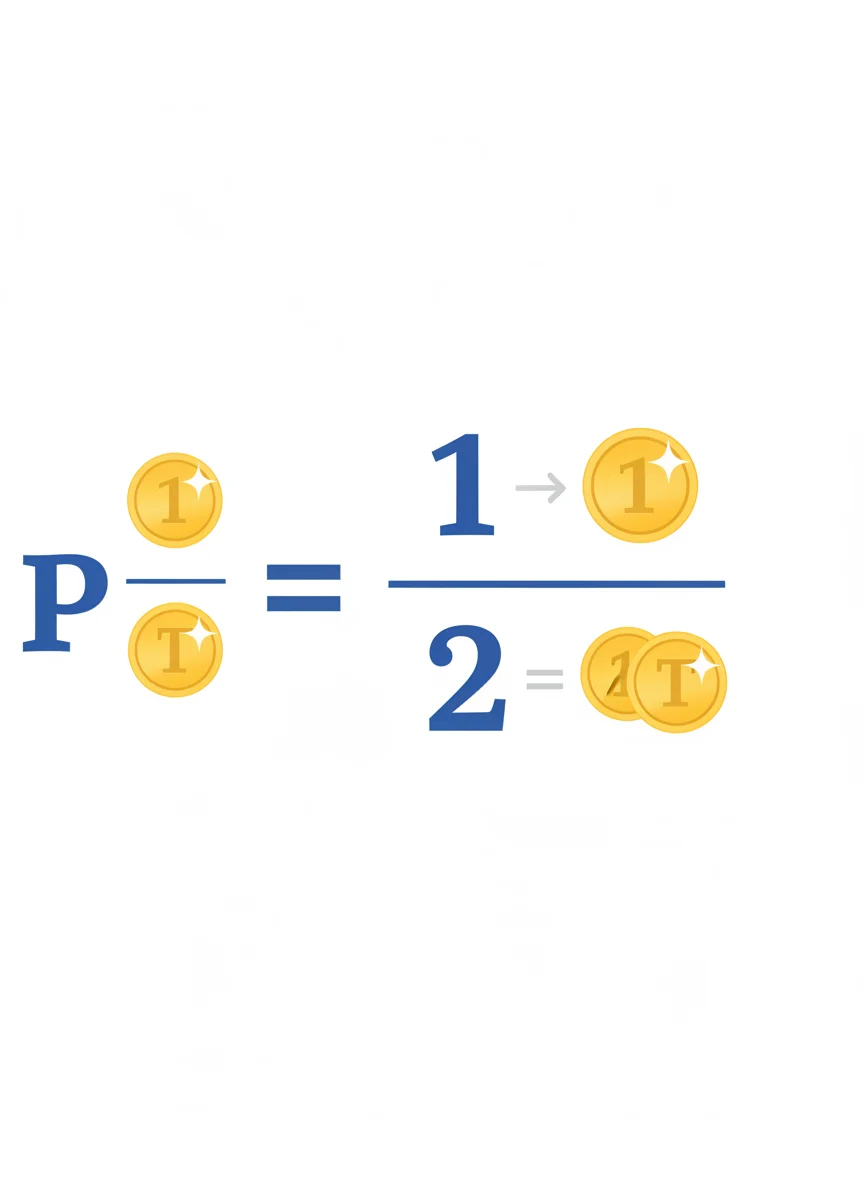
P(event) = Number of favorable outcomes ÷ Total number of possible outcomes Probability is always between 0 and 1 Can be expressed as fractions, decimals, or percentages Example: P(heads) = 1 ÷ 2 = 0.5 = 50%

Practice: Coin Flip Probability
Calculate the theoretical probability of flipping tails Show your work using the formula Express your answer as a fraction, decimal, and percentage Compare with your neighbor's answer
Rolling a Standard Die
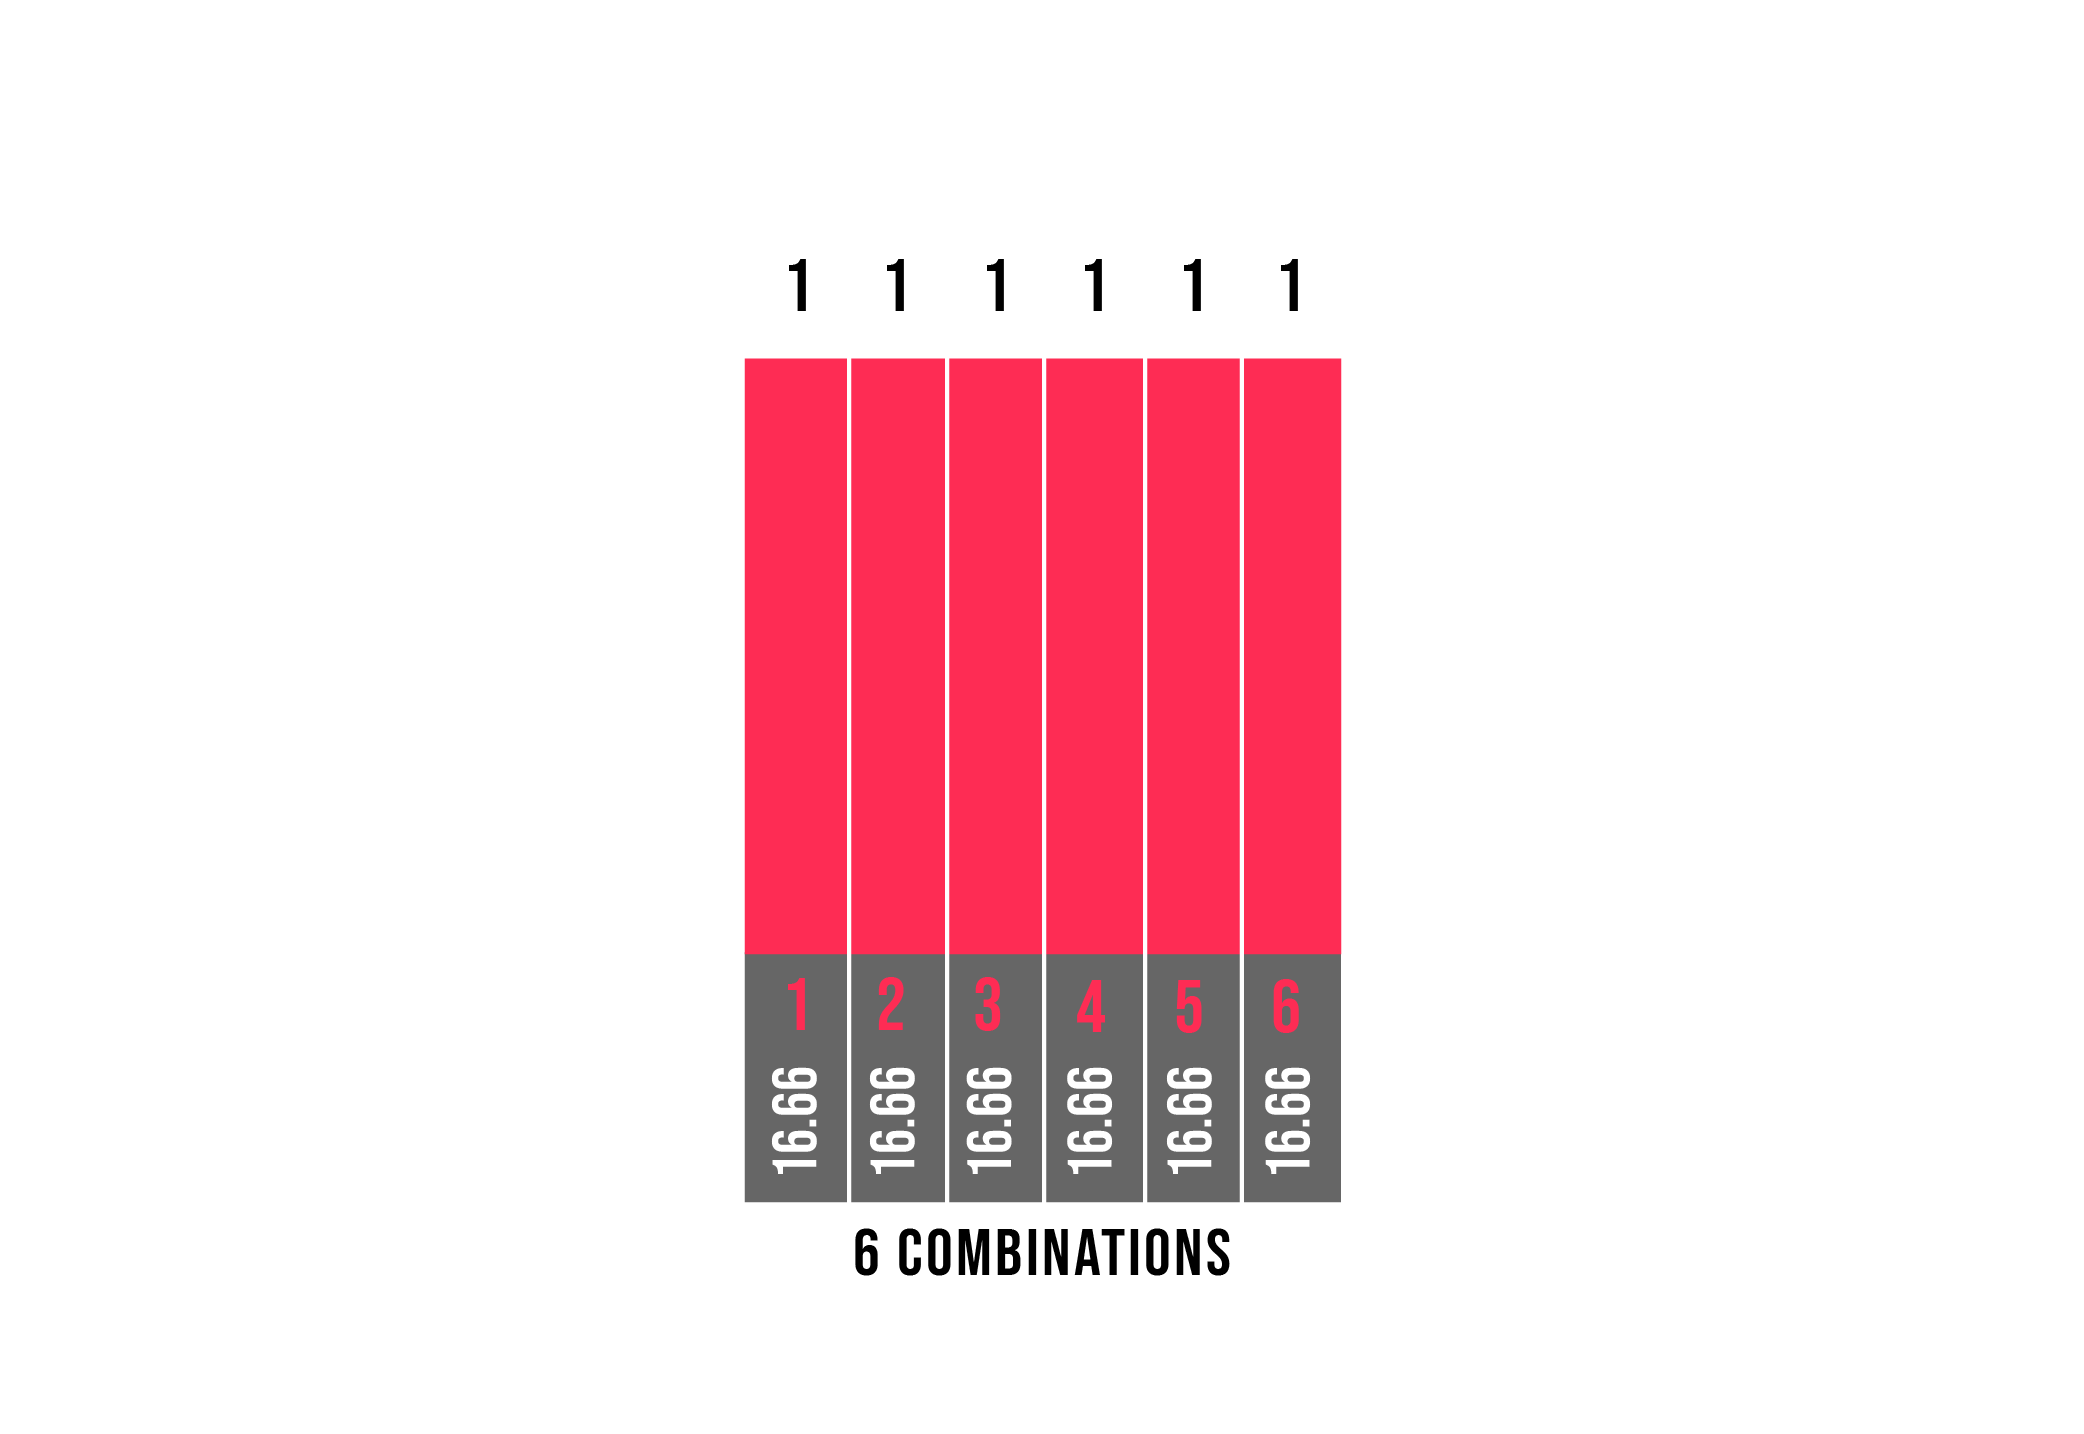
A standard die has 6 equally likely outcomes: 1, 2, 3, 4, 5, 6 P(rolling a 3) = 1/6 ≈ 0.167 ≈ 16.7% P(rolling an even number) = 3/6 = 1/2 = 50% P(rolling a number less than 5) = 4/6 = 2/3 ≈ 66.7%

Think About It: Deck of Cards
A standard deck has 52 cards 13 cards of each suit (hearts, diamonds, clubs, spades) What's the probability of drawing a heart? What's the probability of drawing a face card (Jack, Queen, King)?

Theoretical vs. Experimental Probability
{"left":"Theoretical: Based on mathematical reasoning\nExperimental: Based on actual trials and results\nTheoretical: Calculated before doing experiments\nExperimental: Observed after doing experiments","right":"Theoretical: Always stays the same\nExperimental: Can vary with each set of trials\nBoth should get closer as trials increase\nBoth help us understand likelihood"}

Spinner Challenge
Design a spinner with 8 equal sections 4 red, 2 blue, 1 green, 1 yellow Calculate P(red), P(blue), P(green), P(yellow) Which color is most likely? Least likely?
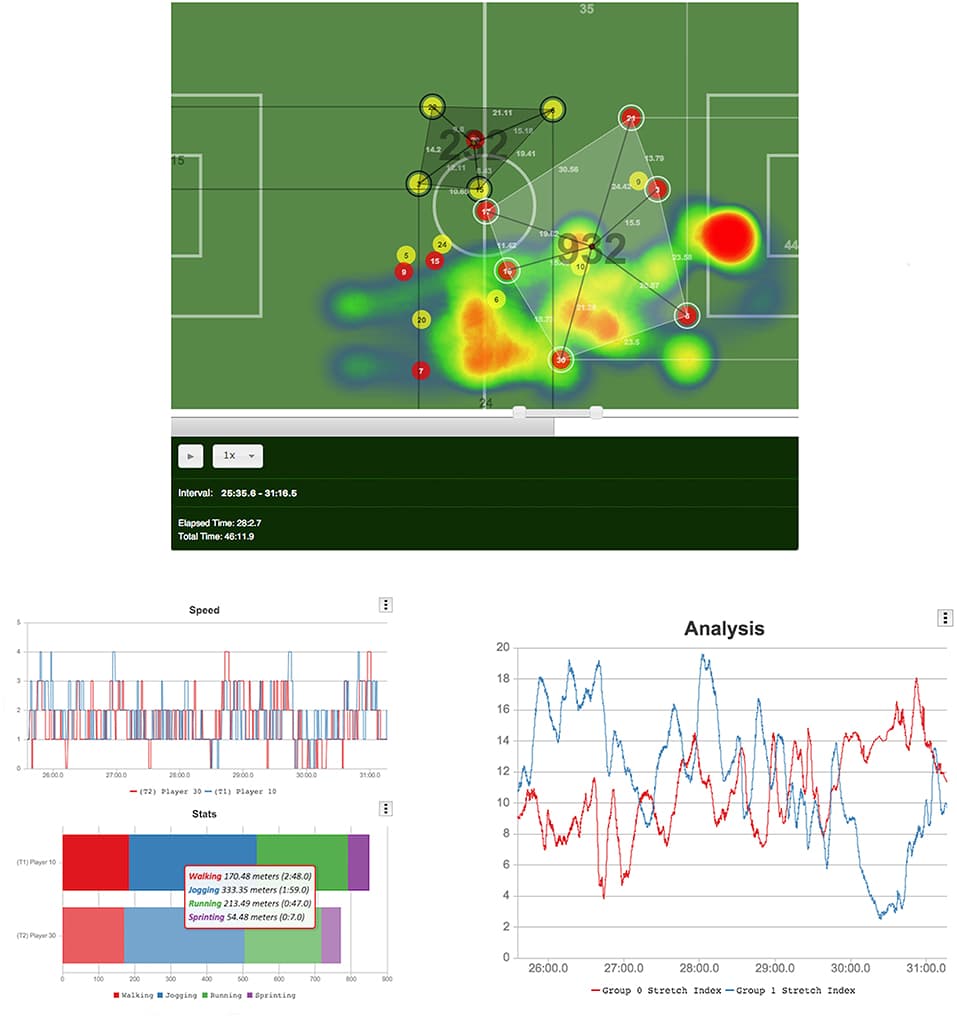
Real-World Applications
Weather forecasting uses probability Sports statistics and predictions Medical diagnosis and treatment success rates Quality control in manufacturing Insurance companies calculate risk Games and lottery odds

Summary: Key Takeaways
Theoretical probability predicts outcomes using math Formula: P(event) = favorable outcomes ÷ total outcomes Probability values range from 0 to 1 Can express as fractions, decimals, or percentages Useful for making predictions before experiments Applies to many real-world situations