ScienceFreePrintable
Cooling Curves Interpretation
A free science worksheet ready for your classroom. Open in Kuraplan to grab the print-ready PDF, customize it for your students, or generate a fresh version in seconds.

Cooling Curves Interpretation

📊 Part 1: Reading Cooling Curves
1. Look at the cooling curve graph above. What does the horizontal (flat) part of the line represent?
Temperature is still dropping
Temperature stays constant during a phase change
The substance is heating up
An error in measurement
2. During the plateau (flat section) of a cooling curve, what is happening to the particles?
They are moving faster
Energy is being used to form bonds between particles
They are gaining kinetic energy
Nothing is happening
3. Which of the following statements about freezing points are true? (Check all that apply)
The freezing point appears as a plateau on a cooling curve
Different substances have different freezing points
Temperature continues to drop during freezing
The freezing point and melting point are the same temperature
4. Water freezes at ______°F. On a cooling curve, this would appear as a _____________ section.
Fill in the blanks: Water freezes at _______°F. On a cooling curve, this would appear as a _____________ section.
🔬 Part 2: Analyzing Phase Changes
5. Imagine you are cooling liquid water from 70°F to 10°F. Describe what happens to the temperature during each phase of cooling:
From 70°F to 32°F (liquid water cooling):
At 32°F (freezing occurs):
From 32°F to 10°F (solid ice cooling):
6. Explain in your own words why the temperature stays constant during a phase change, even though heat is still being removed.
7. A scientist observes a cooling curve with a plateau at 212°F and another at 32°F. What substance is most likely being cooled, and what phase changes occur at each plateau?
✏️ Part 3: Graph Analysis
8. In the space below, sketch a simple cooling curve for a pure substance cooling from liquid to solid. Label the following: liquid phase, solid phase, freezing point, and temperature on the y-axis and time on the x-axis.
9. Real-world connection: Describe a situation from everyday life where you have observed the freezing process. How does what you learned about cooling curves help explain what you observed?
About This Worksheet
Free in Kuraplan
Sign up free, grab the PDF, and customize it for your class.
Print-Ready
Formatted for standard paper. Clean layout, easy to read.
AI-Generated
Created with Kuraplan's AI, designed for real classroom use.
For Teachers & Parents
Use in classrooms, for homework, tutoring, or homeschool.
Need a custom version of this worksheet?
Kuraplan's AI generates custom worksheets in seconds — differentiated for every learner, aligned to your curriculum.
Generate Custom Worksheets — Free No credit card Curriculum-aligned Under 60 seconds
More Science Worksheets
7th Grade–8th Grade
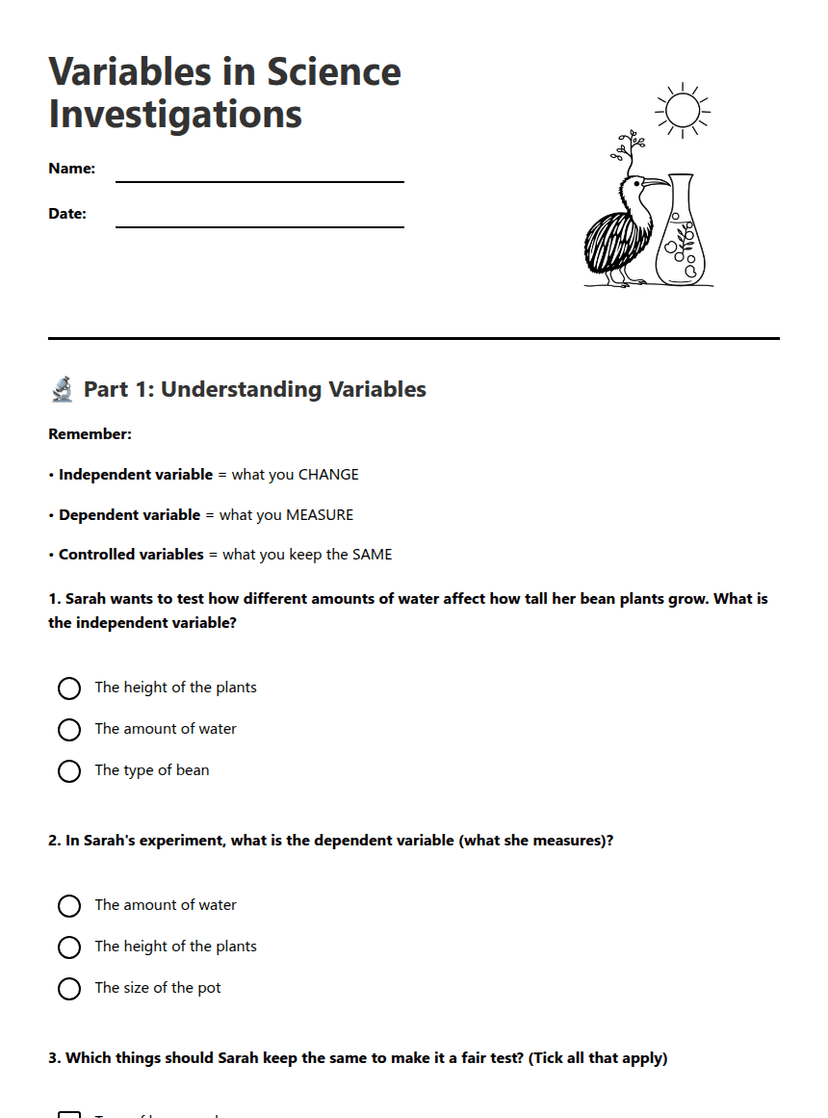
Variables in Science Investigations
Free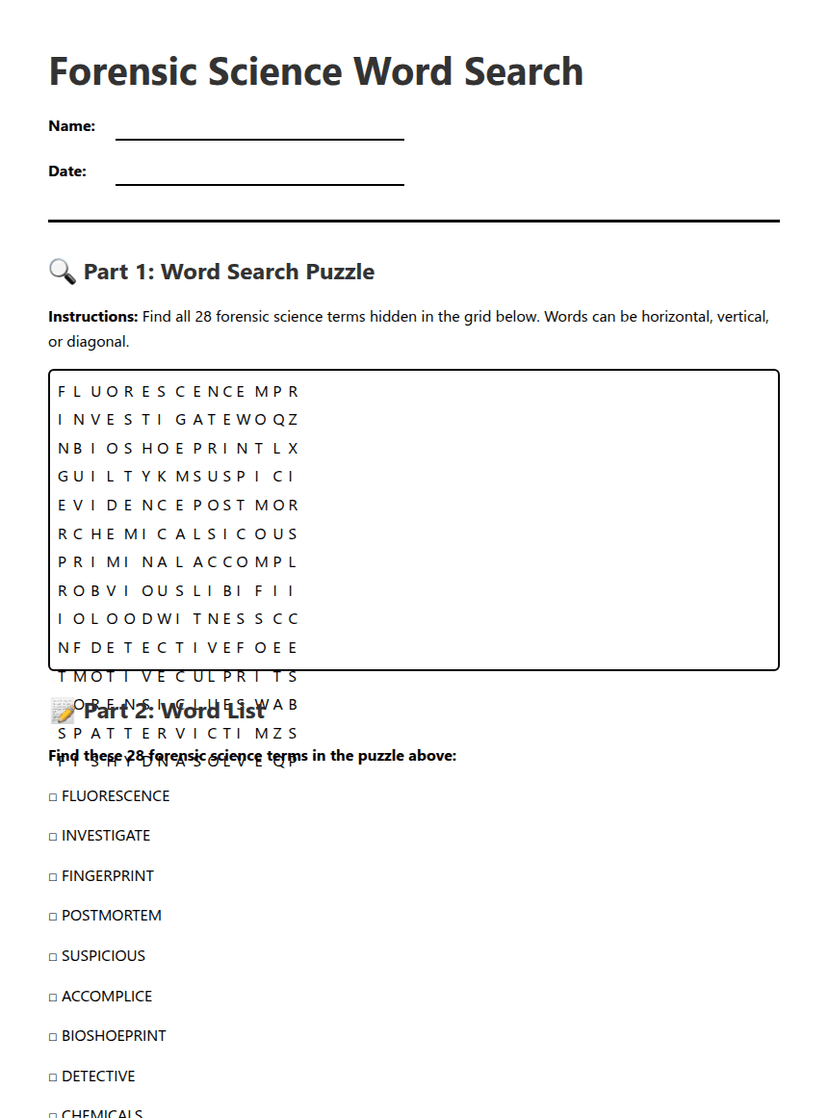
6th Grade–7th Grade
Forensic Science Word Search
Free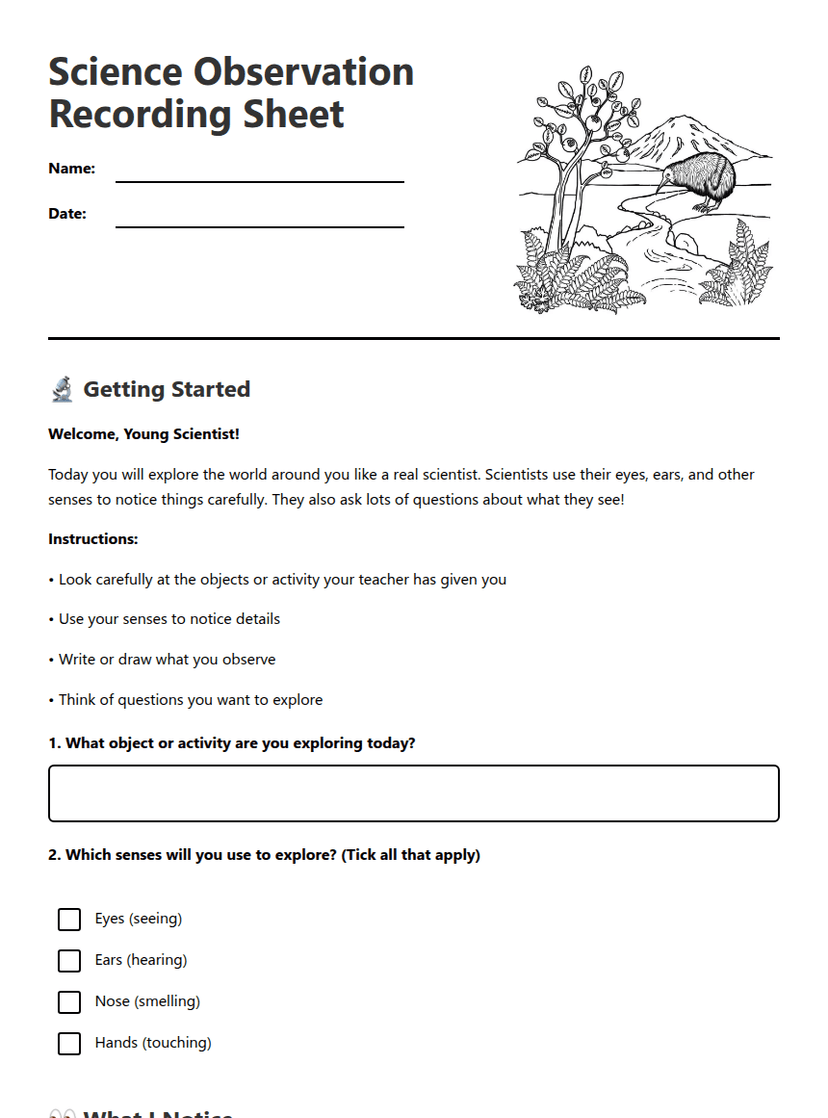
7th Grade–8th Grade
Science Observation Recording Sheet
Free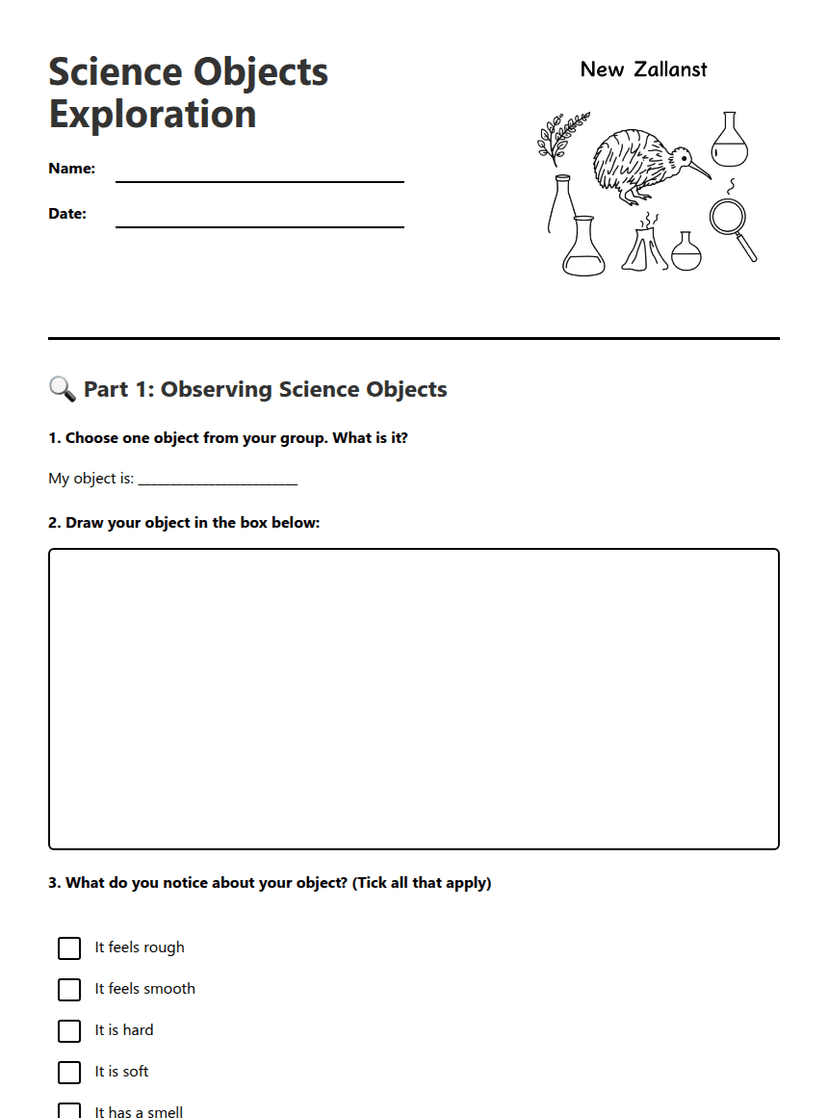
7th Grade–8th Grade
Science Objects Exploration
Free
10th Grade
Sports Science Introduction
Free
11th Grade–13th Grade
Senior Social Science Icebreaker
Free
7th Grade–8th Grade
What is Science?
Free
5th Grade