Analyzing Anomalous Data
A free science worksheet ready for your classroom. Open in Kuraplan to grab the print-ready PDF, customize it for your students, or generate a fresh version in seconds.

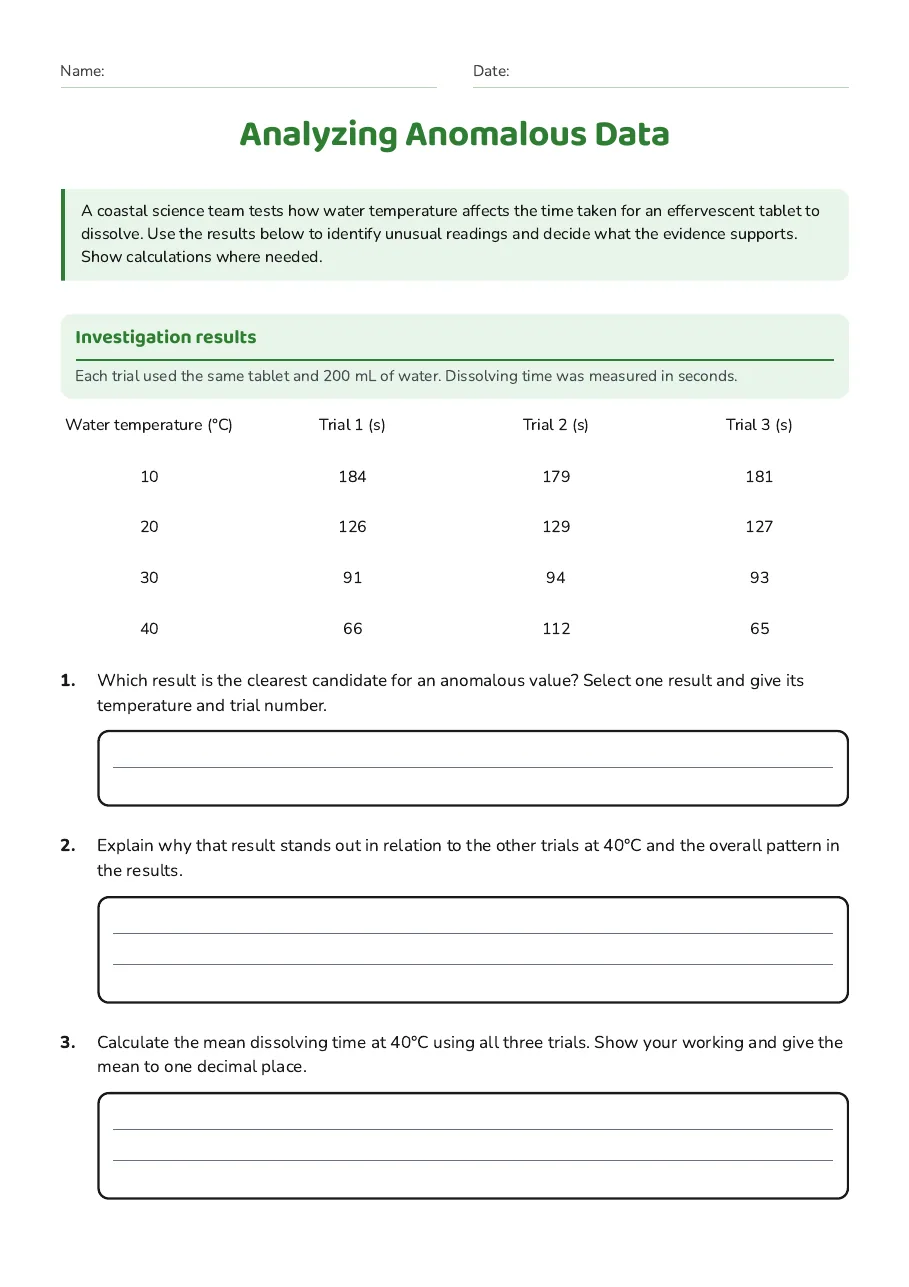
Analyzing Anomalous Data
Investigation results
Each trial used the same tablet and 200 mL of water. Dissolving time was measured in seconds.
Water temperature (°C)
Trial 1 (s)
Trial 2 (s)
Trial 3 (s)
10
184
179
181
20
126
129
127
30
91
94
93
40
66
112
65
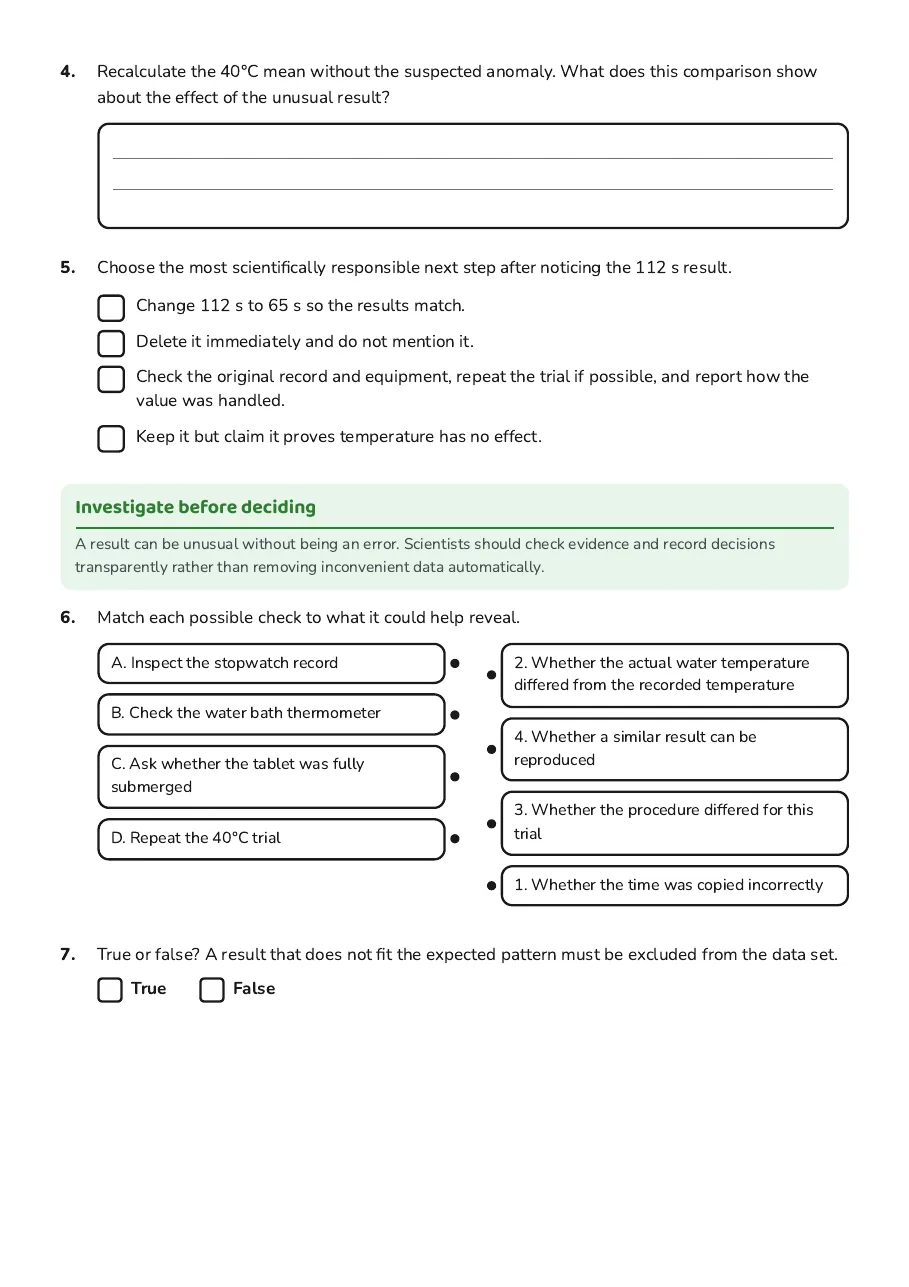
- Change 112 s to 65 s so the results match.
- Delete it immediately and do not mention it.
- Check the original record and equipment, repeat the trial if possible, and report how the value was handled.
- Keep it but claim it proves temperature has no effect.
Investigate before deciding
A result can be unusual without being an error. Scientists should check evidence and record decisions transparently rather than removing inconvenient data automatically.
- A. Inspect the stopwatch record
- B. Check the water bath thermometer
- C. Ask whether the tablet was fully submerged
- D. Repeat the 40°C trial
- 2. Whether the actual water temperature differed from the recorded temperature
- 4. Whether a similar result can be reproduced
- 3. Whether the procedure differed for this trial
- 1. Whether the time was copied incorrectly
3 printable pages
Page 1
Page 2
Page 3
About This Worksheet
Free in Kuraplan
Sign up free, grab the PDF, and customize it for your class.
Print-Ready
Formatted for standard paper. Clean layout, easy to read.
AI-Generated
Created with Kuraplan's AI, designed for real classroom use.
For Teachers & Parents
Use in classrooms, for homework, tutoring, or homeschool.
Need a custom version of this worksheet?
Kuraplan's AI generates custom worksheets in seconds — differentiated for every learner, aligned to your curriculum.
Generate Custom Worksheets — FreeMore Science Worksheets
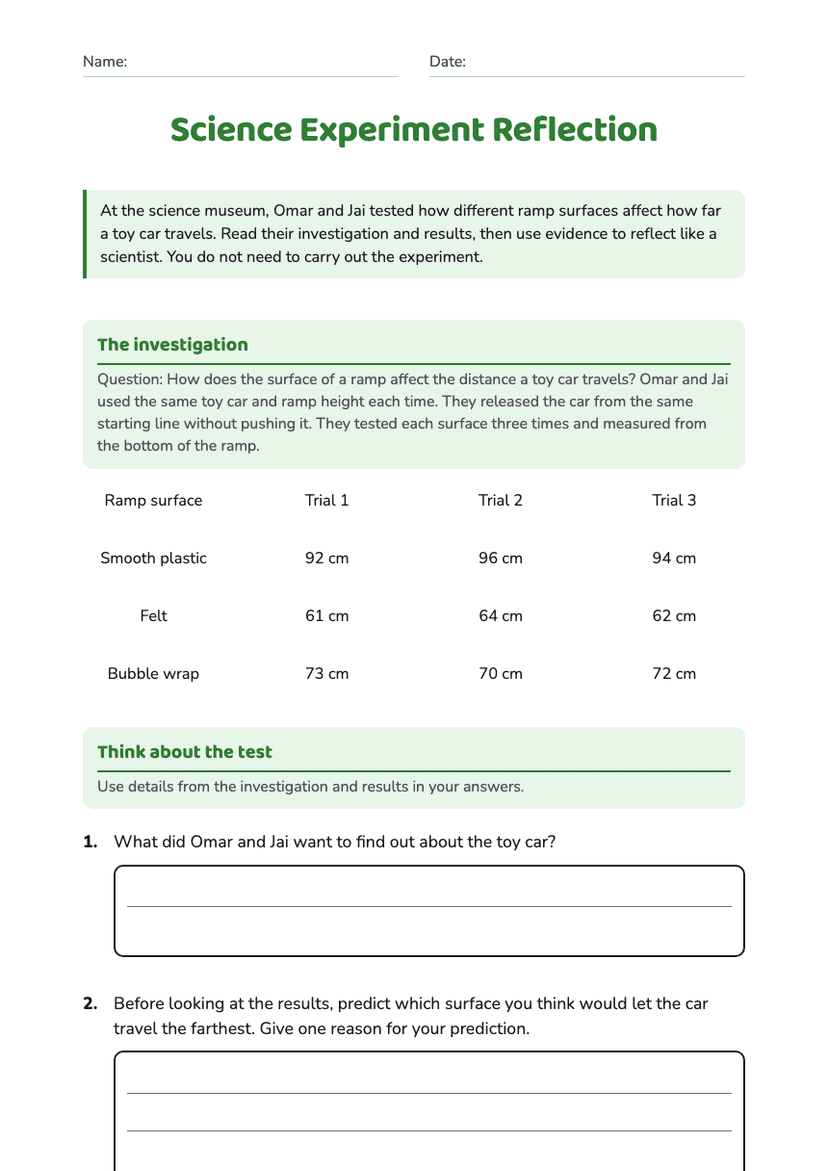
Science Experiment Reflection
Free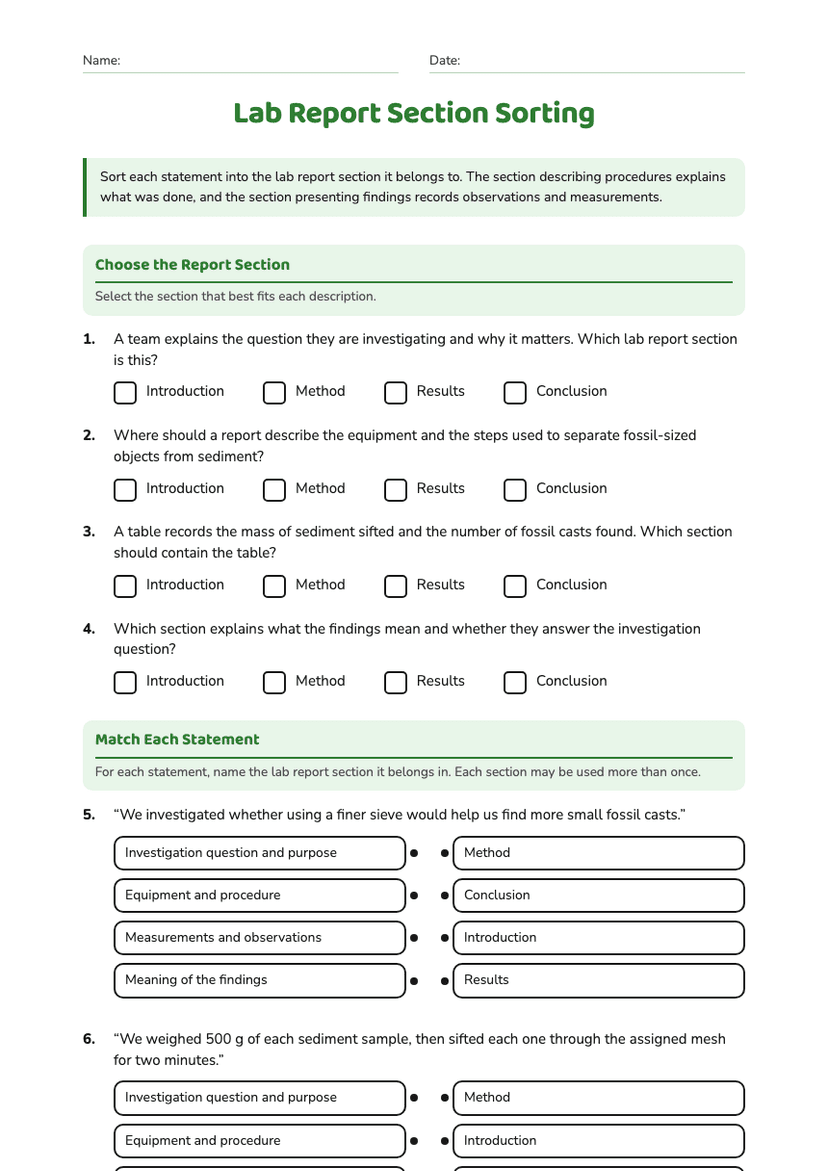
Lab Report Section Sorting
Free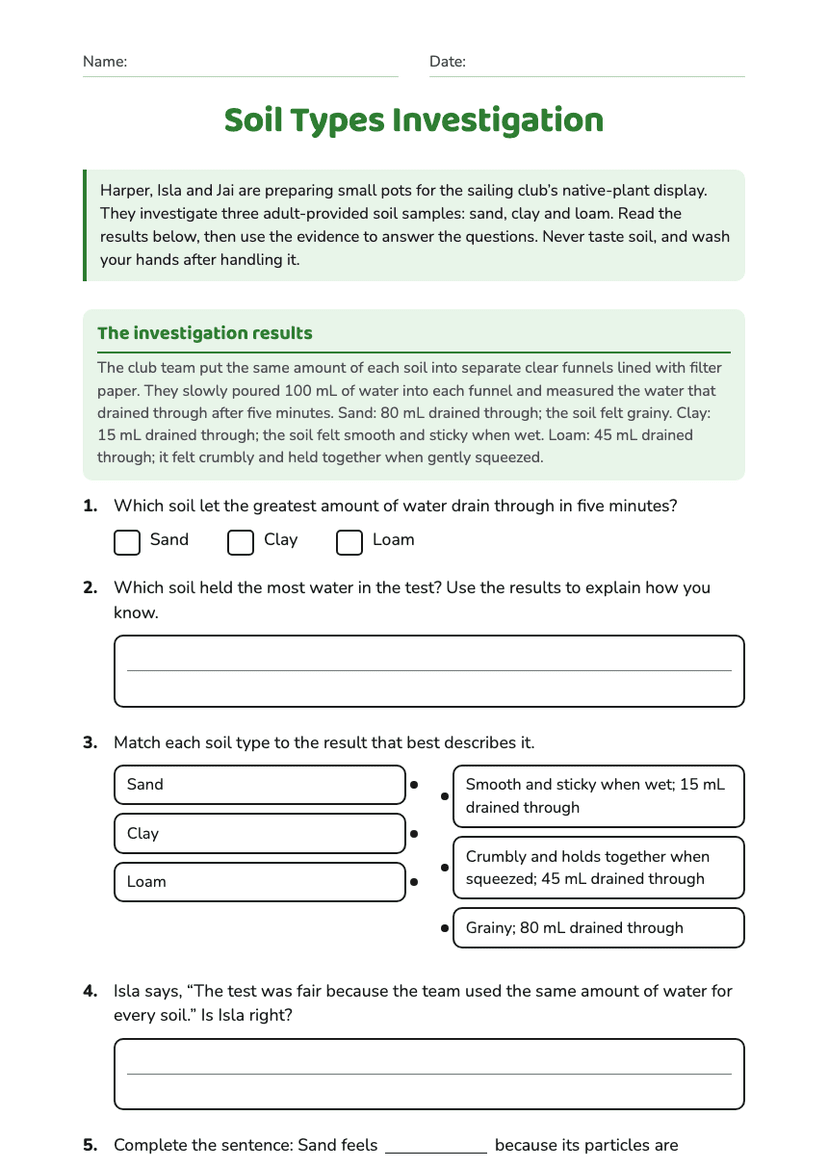
Soil Types Investigation
Free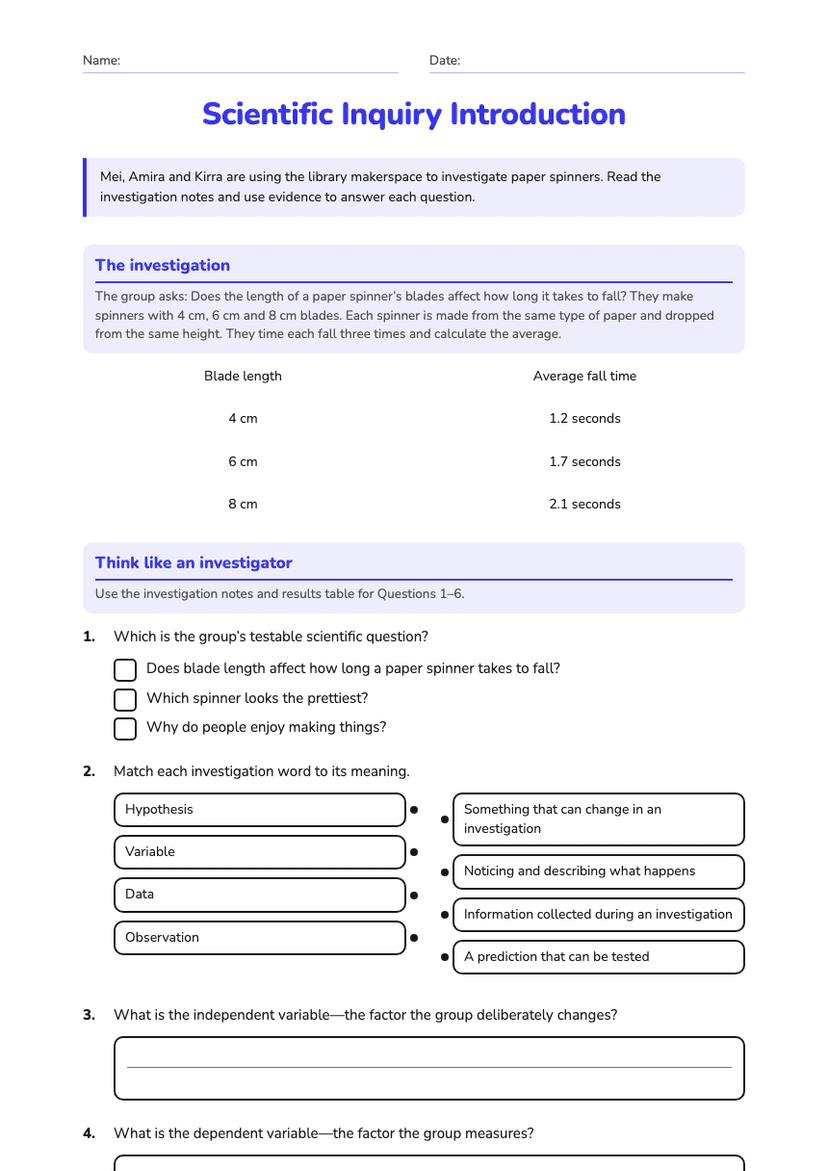
Scientific Inquiry Introduction
Free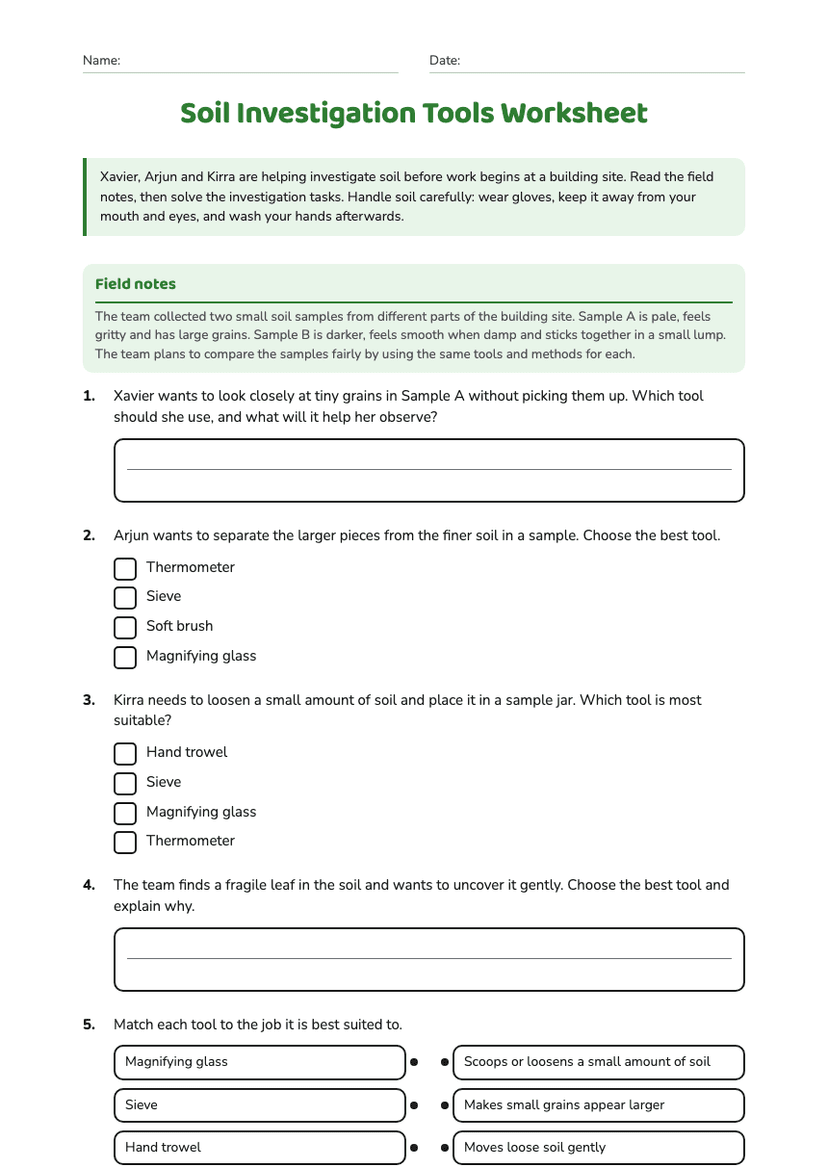
Soil Investigation Tools Worksheet
Free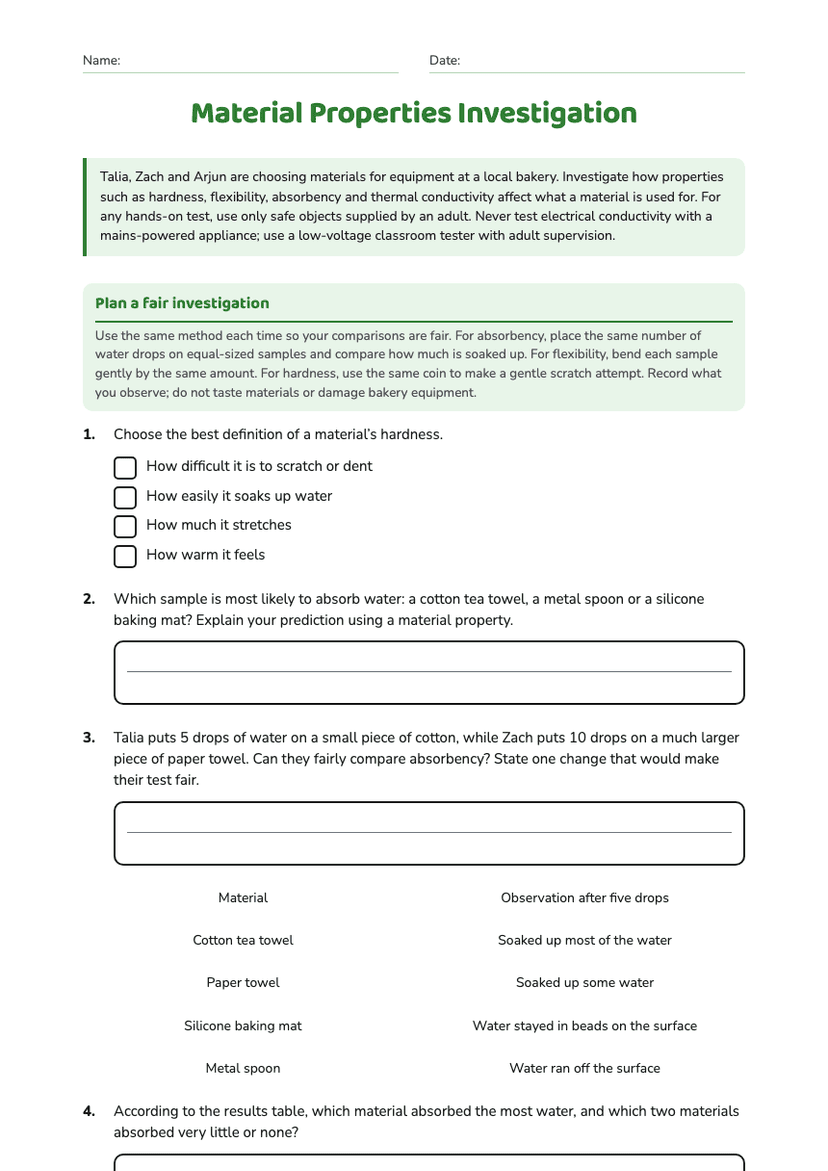
Material Properties Investigation
Free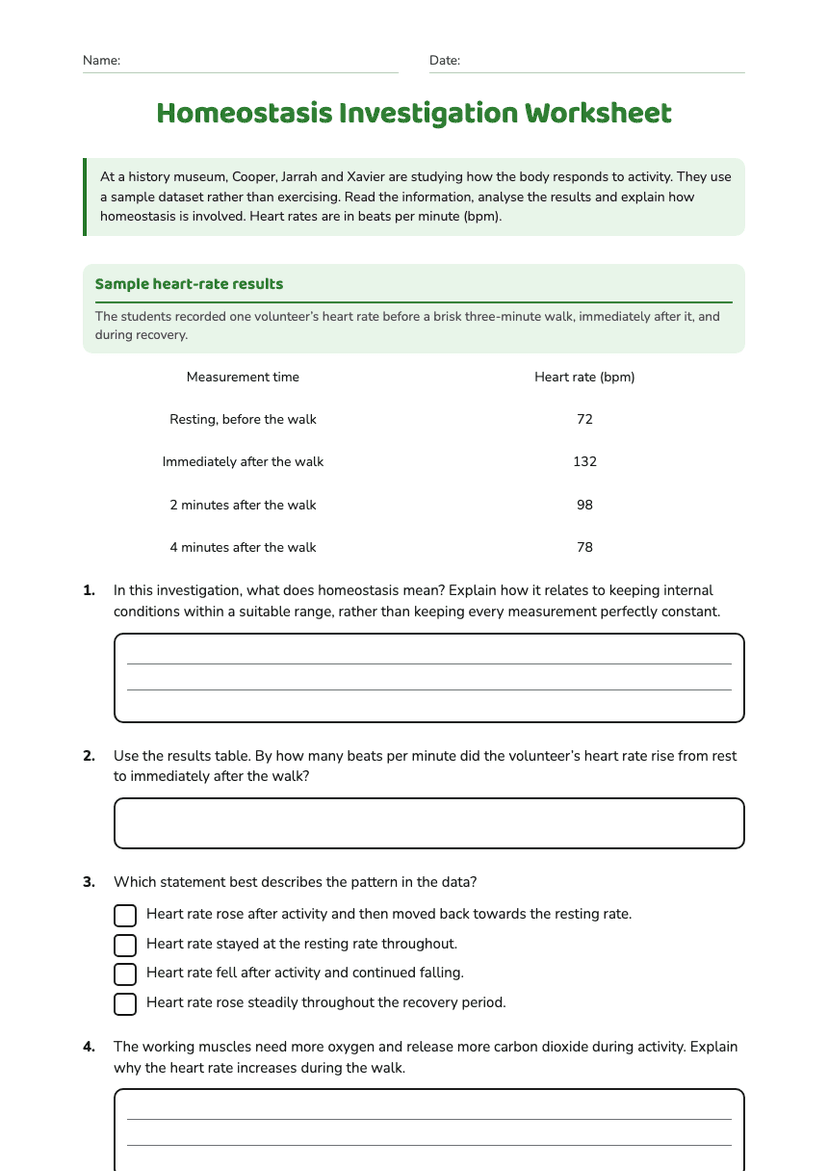
Homeostasis Investigation Worksheet
Free