ScienceFreePrintable

Data Collection and Analysis

A free science worksheet ready for your classroom. Open in Kuraplan to grab the print-ready PDF, customize it for your students, or generate a fresh version in seconds.
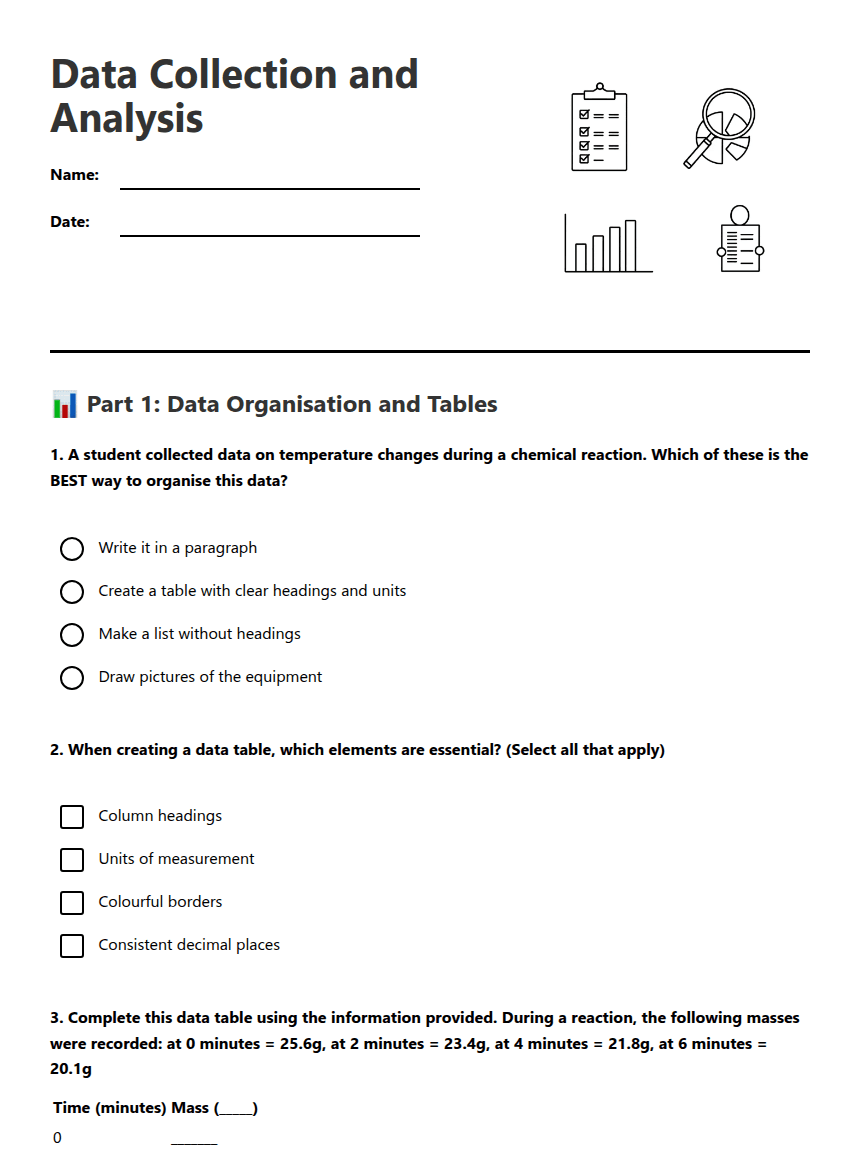
Data Collection and Analysis worksheet preview

Data Collection and Analysis

Scientists collecting data from chemical reactions

📊 Part 1: Data Organisation and Tables

1. A student collected data on temperature changes during a chemical reaction. Which of these is the BEST way to organise this data?

Write it in a paragraph

Create a table with clear headings and units

Make a list without headings

Draw pictures of the equipment

2. When creating a data table, which elements are essential? (Select all that apply)

Column headings

Units of measurement

Colourful borders

Consistent decimal places

3. Complete this data table using the information provided. During a reaction, the following masses were recorded: at 0 minutes = 25.6g, at 2 minutes = 23.4g, at 4 minutes = 21.8g, at 6 minutes = 20.1g
Time (minutes) Mass (_____)
0 _______
_____ 23.4
4 _______
_____ 20.1
4. What trend do you observe in the data from Question 3?

📈 Part 2: Graph Construction and Analysis

5. When creating a graph from experimental data, which type would be most appropriate for showing how temperature changes over time?

Pie chart

Line graph

Bar chart

Pictograph

6. Label the essential components of a scientific graph by filling in the blanks:

a) The horizontal line is called the _____________ axis

b) The vertical line is called the _____________ axis

c) Every graph must have a clear _____________ that describes what the graph shows

d) Both axes must show the _____________ being measured

7. A student plotted the following data points on a graph: (0,50), (5,45), (10,38), (15,32), (20,28). Describe the trend shown by these points:
8. Look at the data in Question 7. One student recorded an additional measurement at 12 minutes showing a temperature of 50°C. Explain whether this data point is reliable and what you would do with it:

🔬 Part 3: Data Analysis and Evaluation

9. A class collected reaction rate data. Some groups got very different results. Which factor would MOST likely cause this variation?

Using different coloured pens to record data

Different room temperatures during experiments

Writing results in different handwriting

Using different table formats

10. Explain why it's important for scientists to organise and present their data clearly. Give TWO reasons:
Extension Activity: Design an improved data collection method for measuring gas production in a chemical reaction. Consider what equipment you would use and how you would ensure accuracy:

About This Worksheet

Free in Kuraplan

Sign up free, grab the PDF, and customize it for your class.

Print-Ready

Formatted for standard paper. Clean layout, easy to read.

AI-Generated

Created with Kuraplan's AI, designed for real classroom use.

For Teachers & Parents

Use in classrooms, for homework, tutoring, or homeschool.

Need a custom version of this worksheet?

Kuraplan's AI generates custom worksheets in seconds — differentiated for every learner, aligned to your curriculum.

Generate Custom Worksheets — Free
No credit card Curriculum-aligned Under 60 seconds