Mass Spectrometry Spectrum Analysis
A free science worksheet ready for your classroom. Open in Kuraplan to grab the print-ready PDF, customize it for your students, or generate a fresh version in seconds.
Mass Spectrometry Spectrum Analysis

📊 Part 1: Understanding Mass Spectra
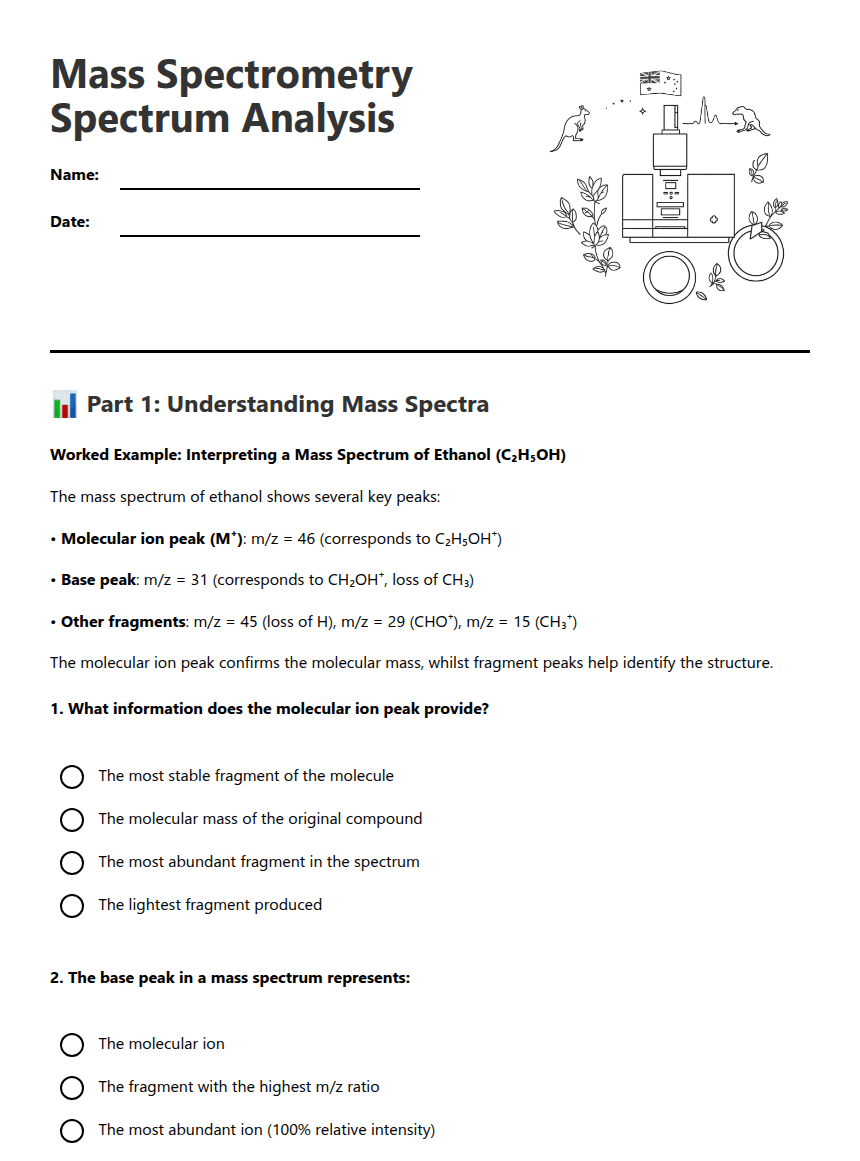
The mass spectrum of ethanol shows several key peaks:
• Molecular ion peak (M⁺): m/z = 46 (corresponds to C₂H₅OH⁺)
• Base peak: m/z = 31 (corresponds to CH₂OH⁺, loss of CH₃)
• Other fragments: m/z = 45 (loss of H), m/z = 29 (CHO⁺), m/z = 15 (CH₃⁺)
The molecular ion peak confirms the molecular mass, whilst fragment peaks help identify the structure.
🔬 Part 2: Spectrum Analysis
Major peaks: m/z = 58 (molecular ion, 15%), m/z = 43 (base peak, 100%), m/z = 15 (25%)
Molecular mass = _________ g/mol
🎯 Part 3: Application Questions
About This Worksheet
Free in Kuraplan
Sign up free, grab the PDF, and customize it for your class.
Print-Ready
Formatted for standard paper. Clean layout, easy to read.
AI-Generated
Created with Kuraplan's AI, designed for real classroom use.
For Teachers & Parents
Use in classrooms, for homework, tutoring, or homeschool.
Need a custom version of this worksheet?
Kuraplan's AI generates custom worksheets in seconds — differentiated for every learner, aligned to your curriculum.
Generate Custom Worksheets — FreeMore Science Worksheets
Elements & Compounds Worksheet
Free
Elements and Compounds Worksheet
Free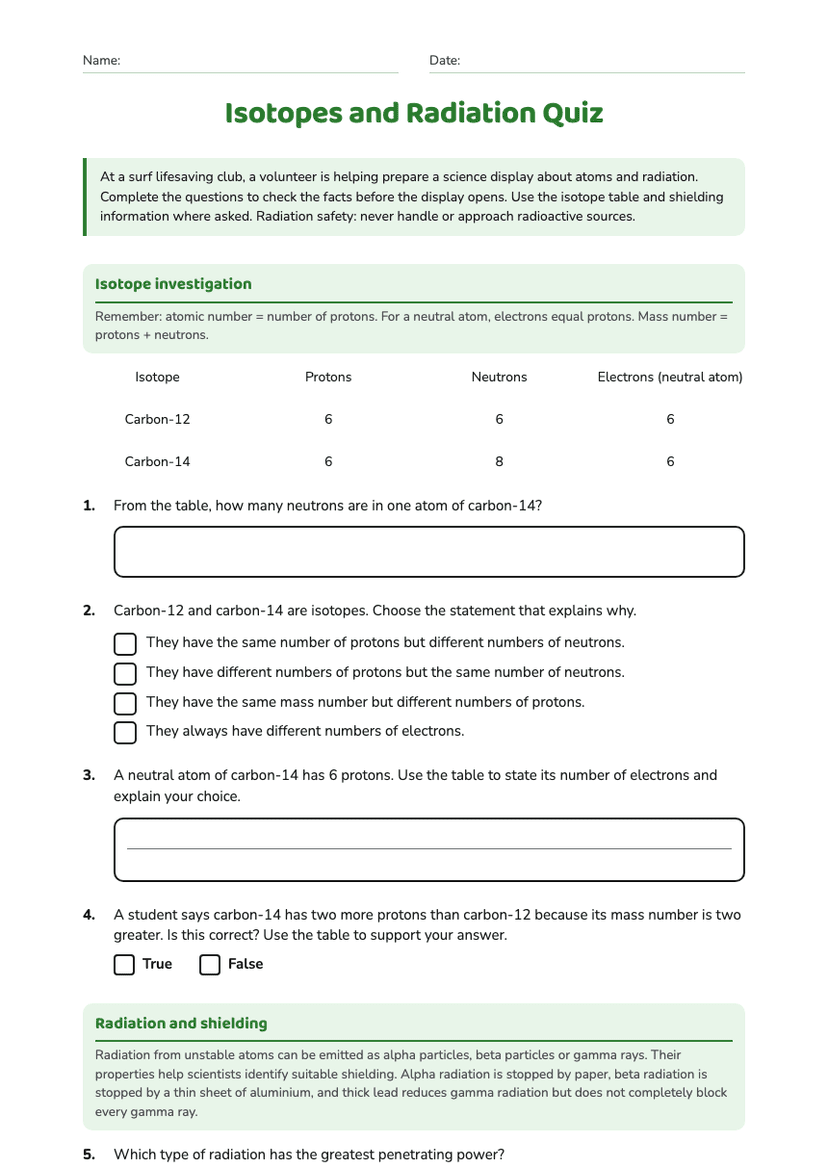
Isotopes and Radiation Quiz
Free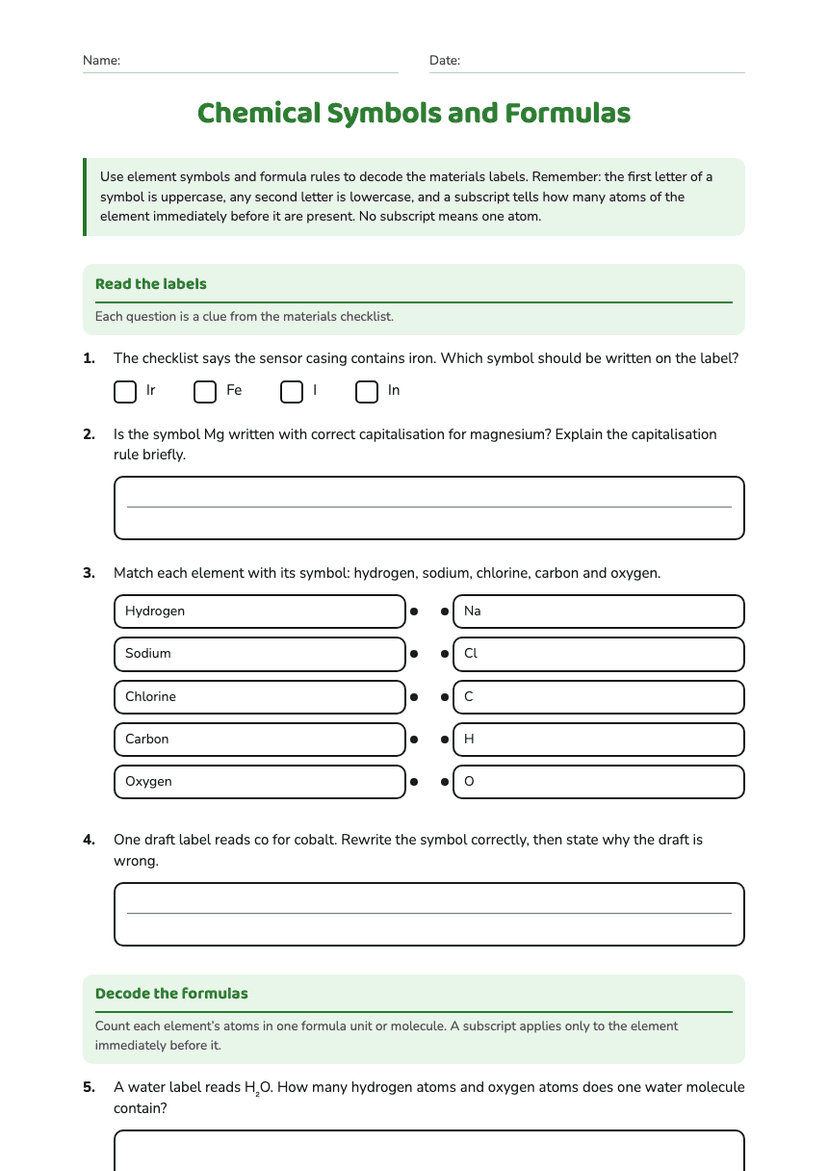
Chemical Symbols and Formulas
Free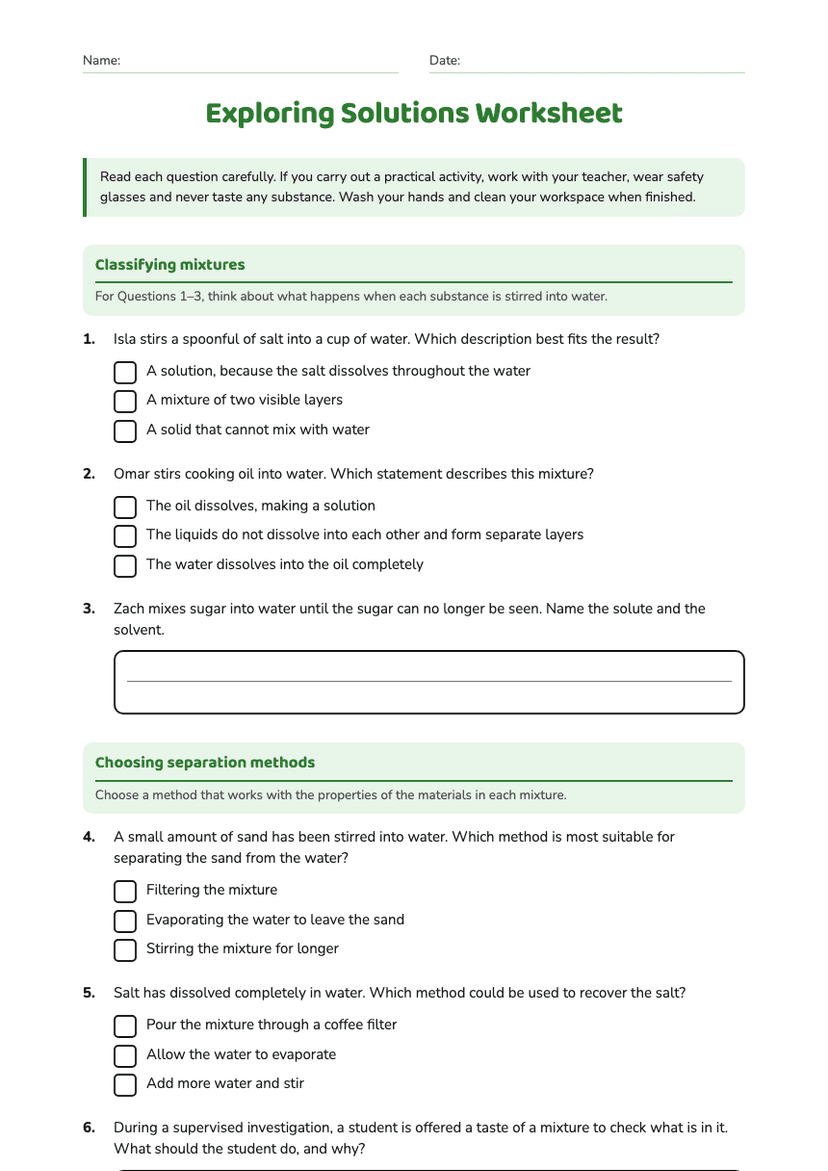
Exploring Solutions Worksheet
Free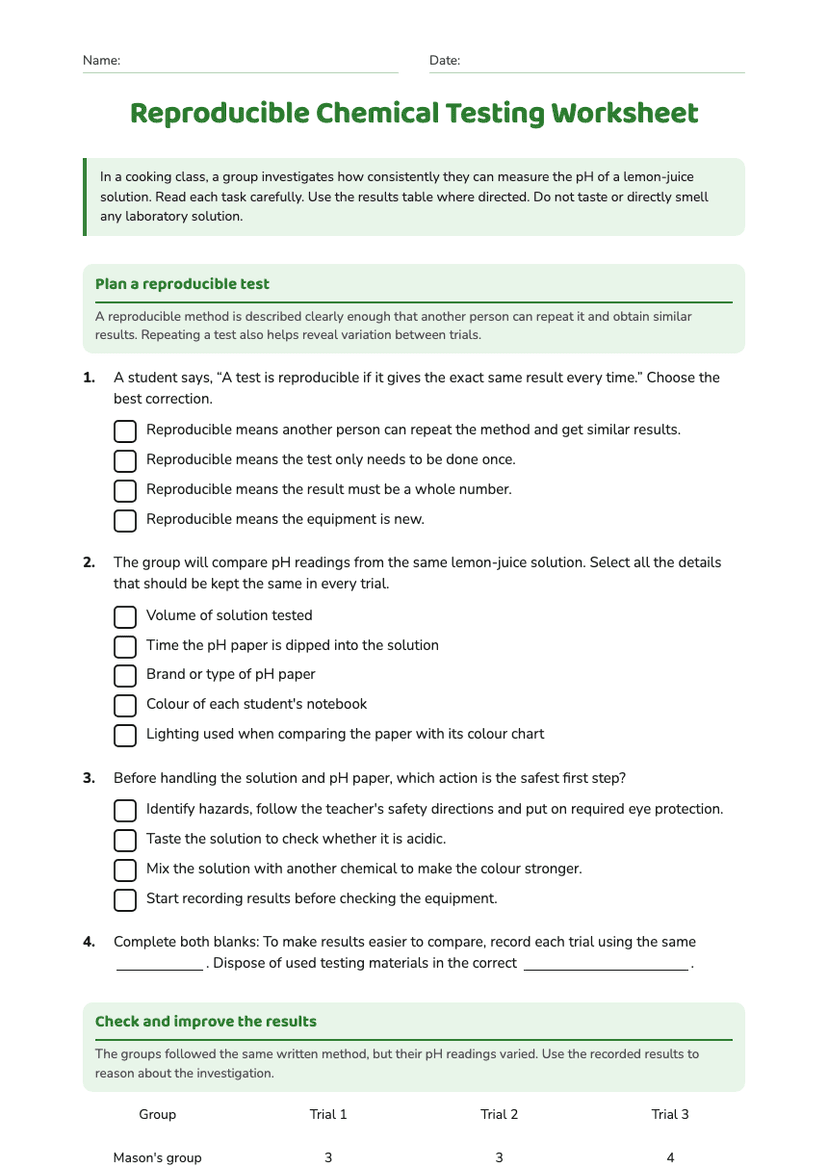
Reproducible Chemical Testing Worksheet
Free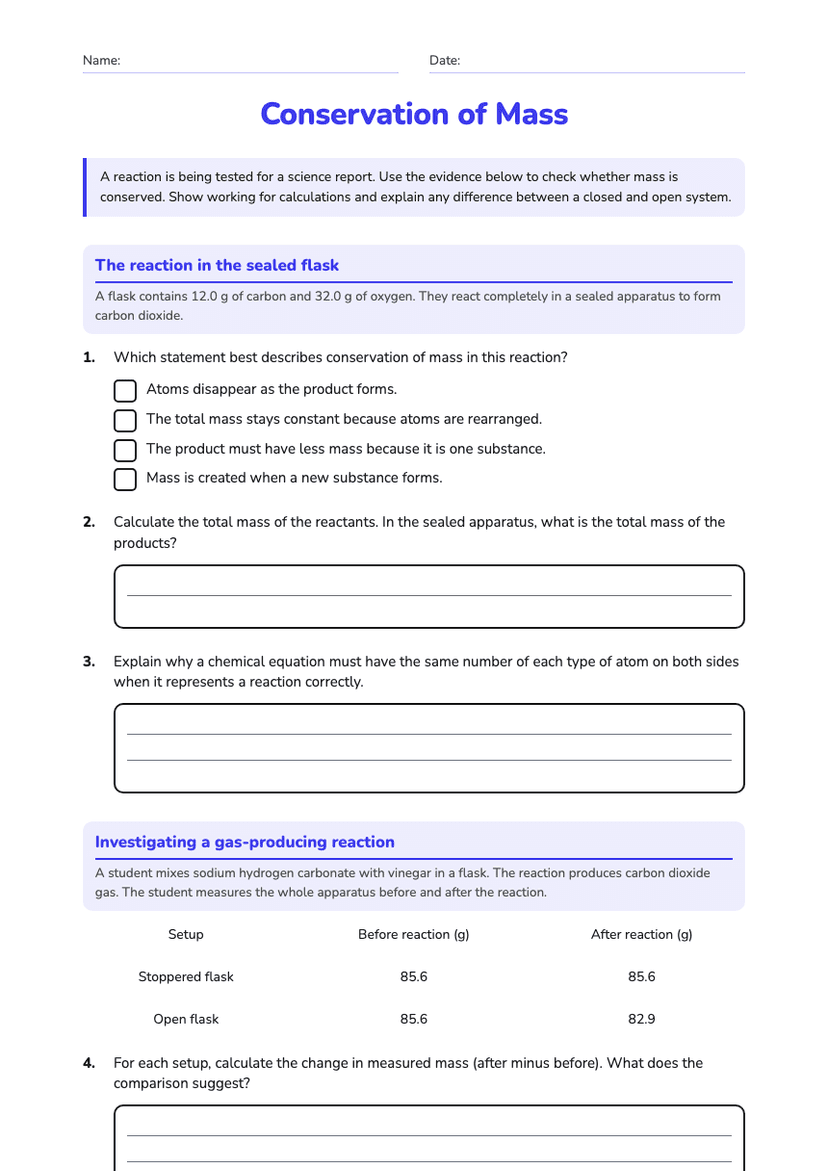
Conservation of Mass
Free