Shadow Data Graphs
A free science worksheet ready for your classroom. Open in Kuraplan to grab the print-ready PDF, customize it for your students, or generate a fresh version in seconds.
Shadow Data Graphs
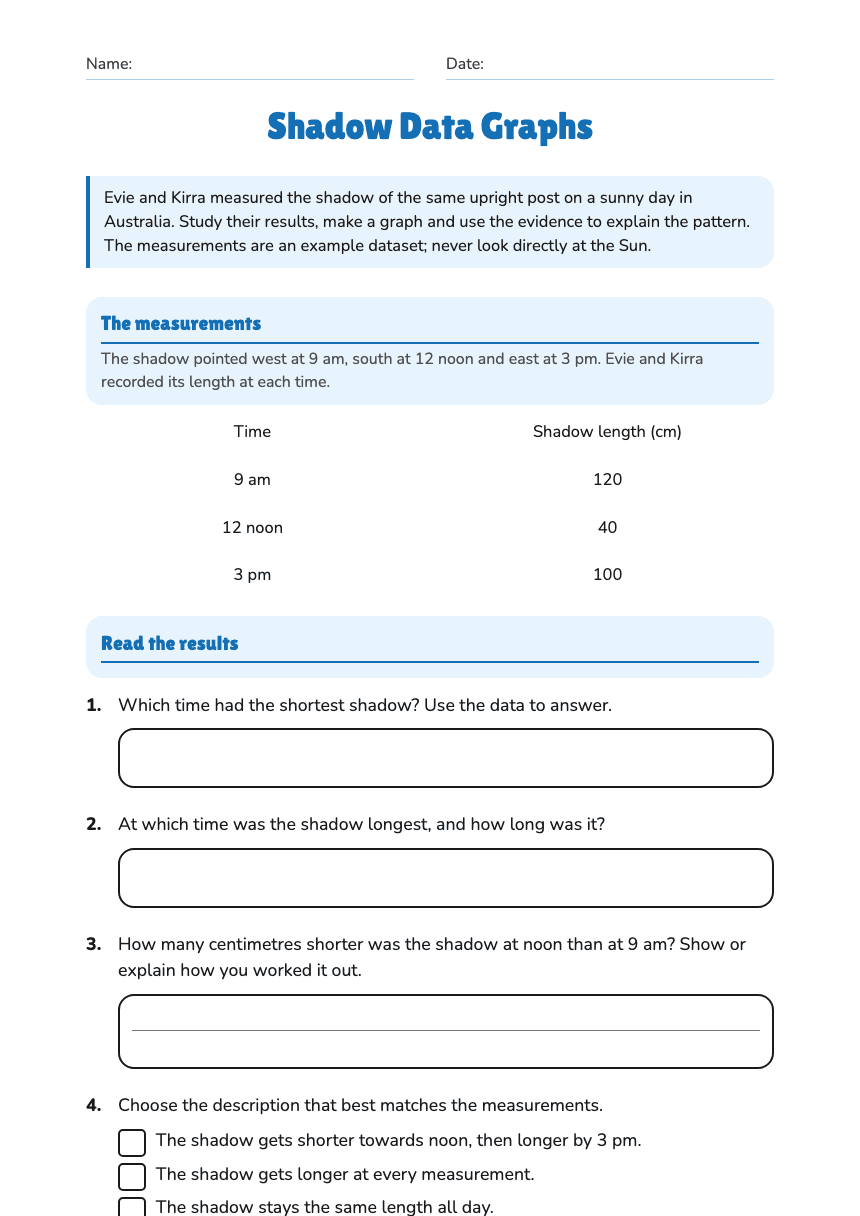
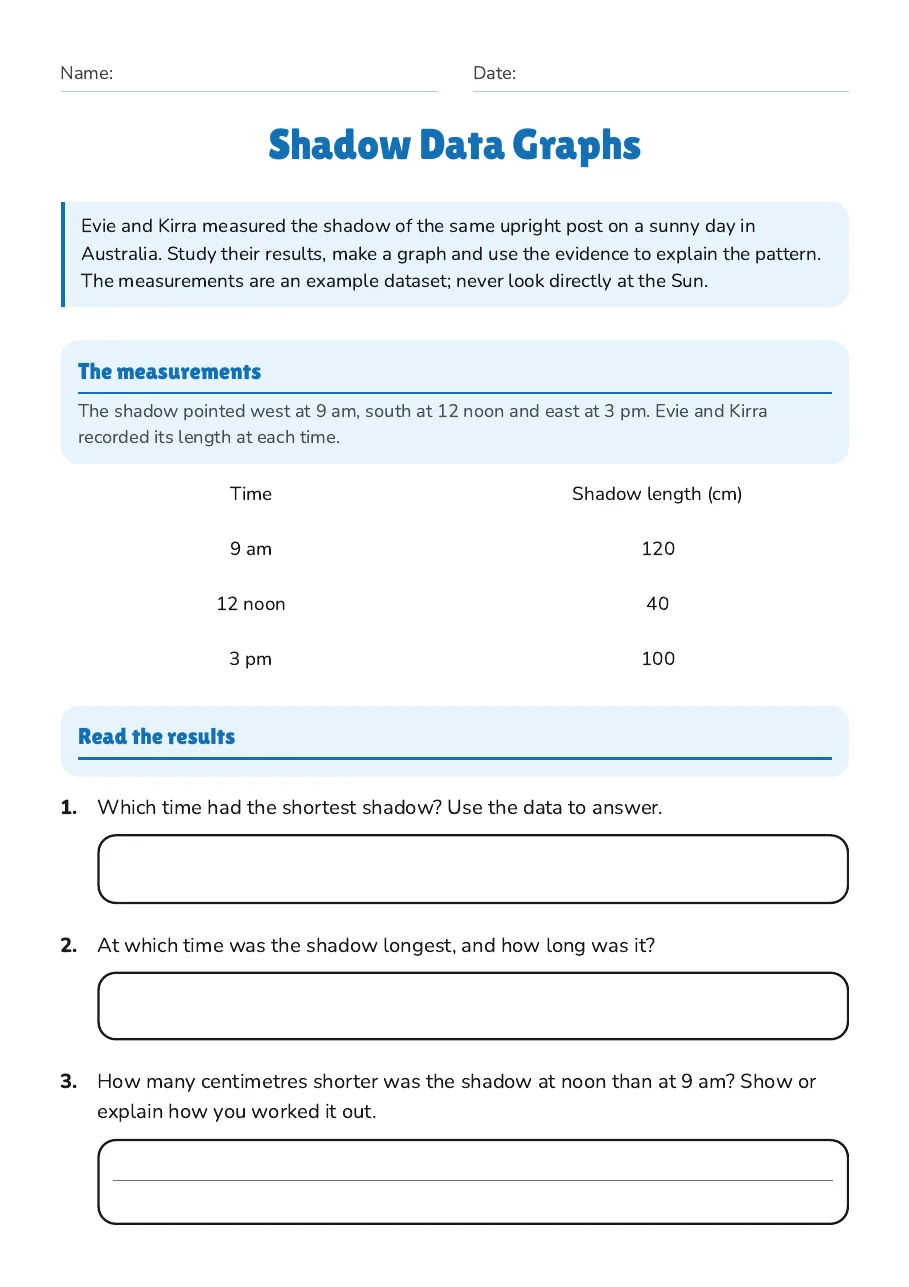
The measurements
The shadow pointed west at 9 am, south at 12 noon and east at 3 pm. Evie and Kirra recorded its length at each time.
Time
Shadow length (cm)
9 am
120
12 noon
40
3 pm
100
Read the results
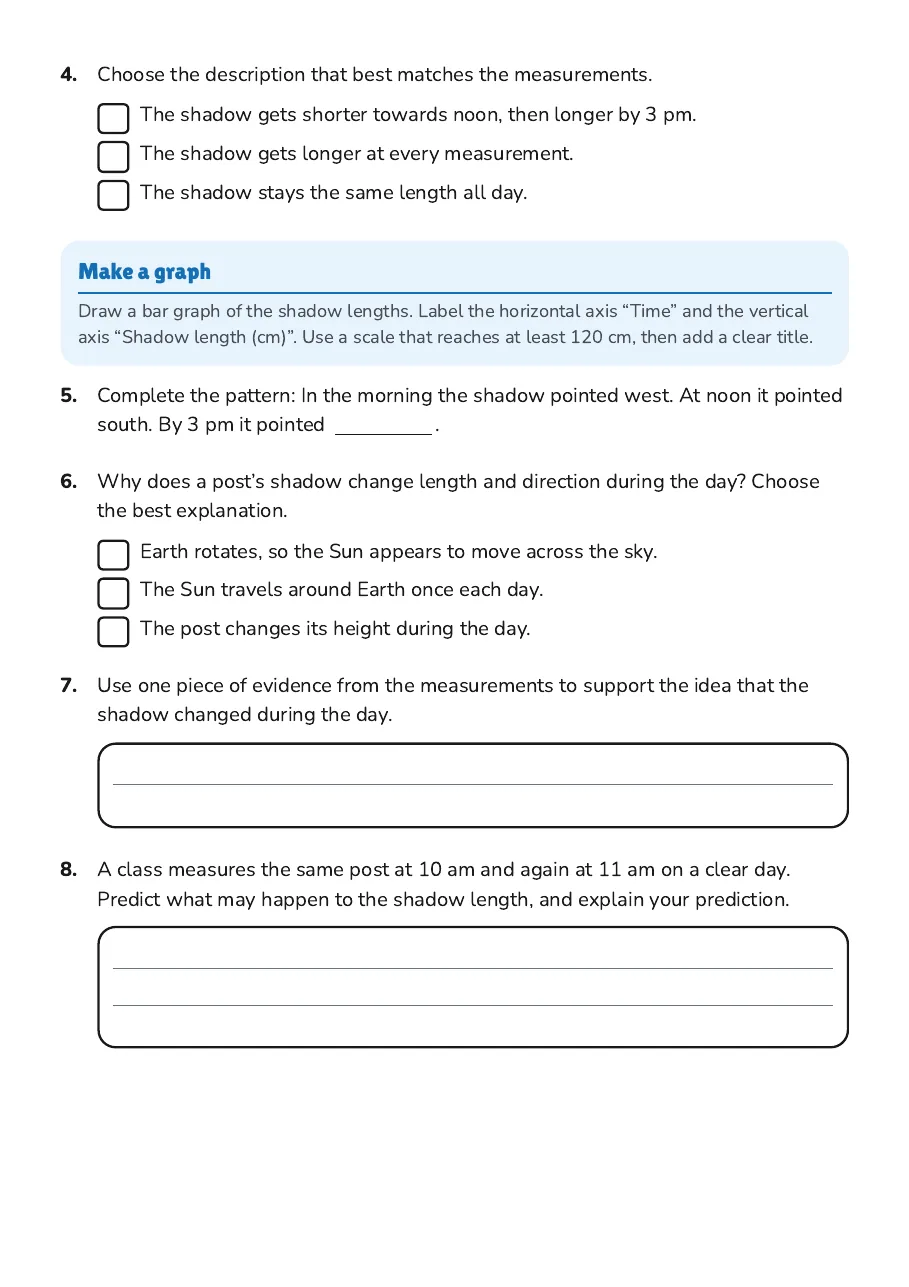
- The shadow gets shorter towards noon, then longer by 3 pm.
- The shadow gets longer at every measurement.
- The shadow stays the same length all day.
Make a graph
Draw a bar graph of the shadow lengths. Label the horizontal axis “Time” and the vertical axis “Shadow length (cm)”. Use a scale that reaches at least 120 cm, then add a clear title.
- Earth rotates, so the Sun appears to move across the sky.
- The Sun travels around Earth once each day.
- The post changes its height during the day.
2 printable pages
Page 1
Page 2
About This Worksheet
Free in Kuraplan
Sign up free, grab the PDF, and customize it for your class.
Print-Ready
Formatted for standard paper. Clean layout, easy to read.
AI-Generated
Created with Kuraplan's AI, designed for real classroom use.
For Teachers & Parents
Use in classrooms, for homework, tutoring, or homeschool.
Need a custom version of this worksheet?
Kuraplan's AI generates custom worksheets in seconds — differentiated for every learner, aligned to your curriculum.
Generate Custom Worksheets — Free