Year 10 Forces Workbook
A free science worksheet ready for your classroom. Open in Kuraplan to grab the print-ready PDF, customize it for your students, or generate a fresh version in seconds.
Year 10 Forces Workbook
📘 Part 1: Theory Notes & Lesson Planning (Read)
WALT: We Are Learning To explain speed, velocity and motion graphs, and plan a simple investigation to measure average speed and change in position.
Key concepts (brief):
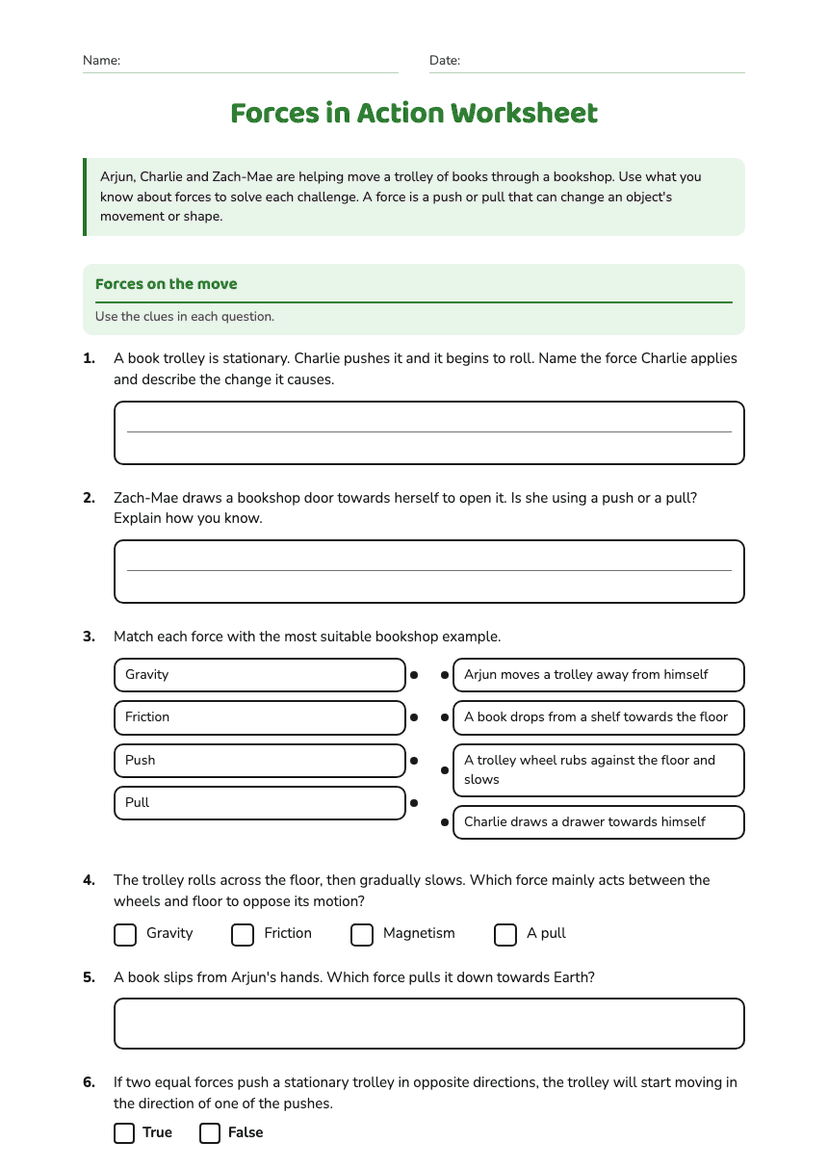
- Distance is the total path length travelled (scalar).
- Displacement is the straight-line change in position (vector) and can be positive, negative or zero.
- Speed = distance/time (scalar). Units: m/s, km/h.
- Velocity = displacement/time (vector). Includes direction.
- Average speed is total distance divided by total time.
- Instantaneous speed is speed at a specific moment; average speed is over an interval.
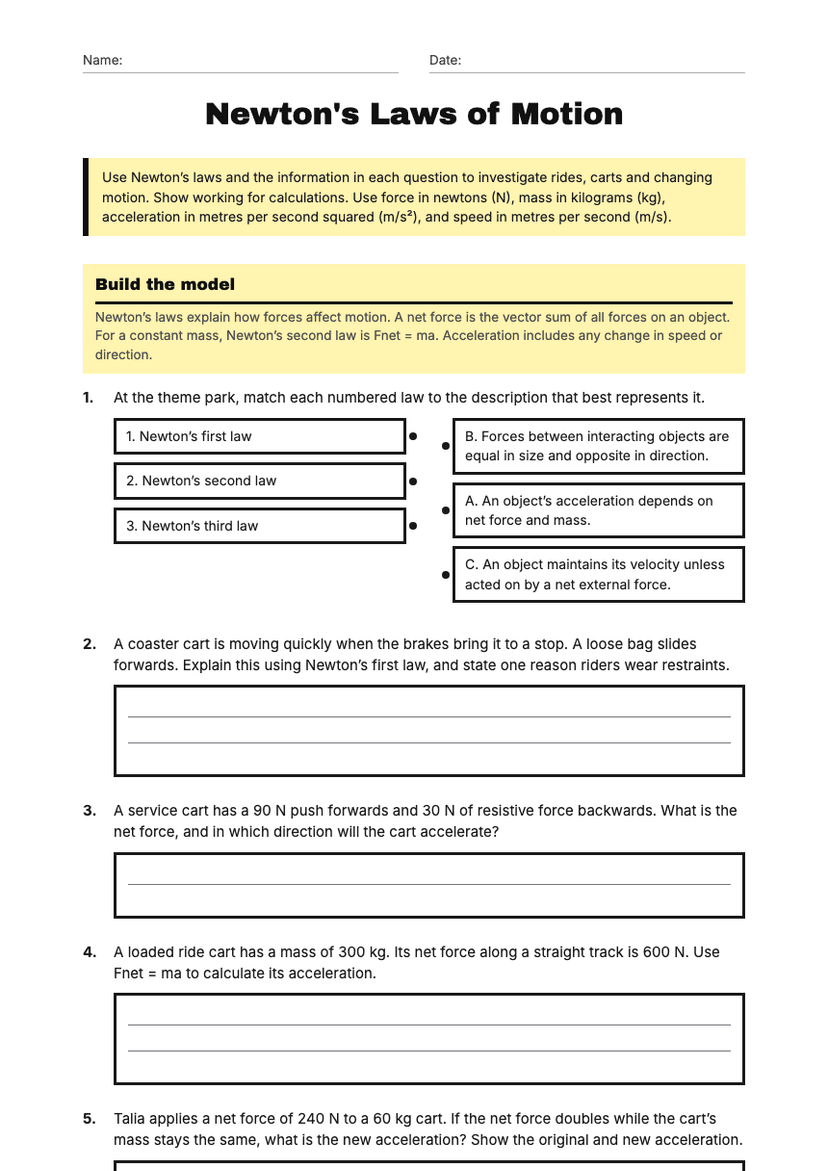
Interpreting graphs: On a distance–time graph, gradient = speed. On a speed–time graph, area under the graph = distance travelled.
Success criteria: I can (a) calculate speed and velocity from given data, (b) distinguish distance from displacement in examples, (c) draw and interpret distance–time and speed–time graphs, (d) plan and record a simple motion investigation.
Differentiation strategies: Provide worked examples and formula sheet for learners who need support; use step-by-step scaffolded questions and calculators. Offer extension tasks (challenge problems) and ask advanced learners to include vector notation and unit conversions.
Dyslexia-friendly reading options: Use larger sans-serif font, short paragraphs, bullet points, high-contrast text, and colour-coded key terms (teacher to prepare handout).
For Year 7 PowerPoint (teacher note): Include WALT on slide 1, 3 simple examples with visuals (walking, car, toy car), one slide on distance vs displacement, one on graphs with animations, and a short class practical slide.
✏️ Part 2: Questions & Practical Tasks
🔬 Part 3: Practical Recording & Reflection
Teacher checklist: Success criteria tick-boxes: clear calculations, labelled graphs, investigation plan with controlled variables, consideration of uncertainty. Offer extension: convert speeds between m/s and km/h and include vector notation for velocity answers.
About This Worksheet
Free in Kuraplan
Sign up free, grab the PDF, and customize it for your class.
Print-Ready
Formatted for standard paper. Clean layout, easy to read.
AI-Generated
Created with Kuraplan's AI, designed for real classroom use.
For Teachers & Parents
Use in classrooms, for homework, tutoring, or homeschool.
Need a custom version of this worksheet?
Kuraplan's AI generates custom worksheets in seconds — differentiated for every learner, aligned to your curriculum.
Generate Custom Worksheets — Free