Error Bars and Uncertainty
A free science worksheet ready for your classroom. Open in Kuraplan to grab the print-ready PDF, customize it for your students, or generate a fresh version in seconds.
Error Bars and Uncertainty
📊 Part 1: Understanding Uncertainty
🔢 Part 2: Calculating Uncertainties
Percentage uncertainty = ___________
a) Calculate the mean time: ___________
b) Calculate the range: ___________
c) Estimate the uncertainty (range ÷ 2): ___________
📈 Part 3: Interpreting Error Bars
Conclusion: ________________________________
a) The precision of the measurements: ________________________________
b) The reliability of any conclusions: ________________________________
c) Possible improvements to the experiment: ________________________________
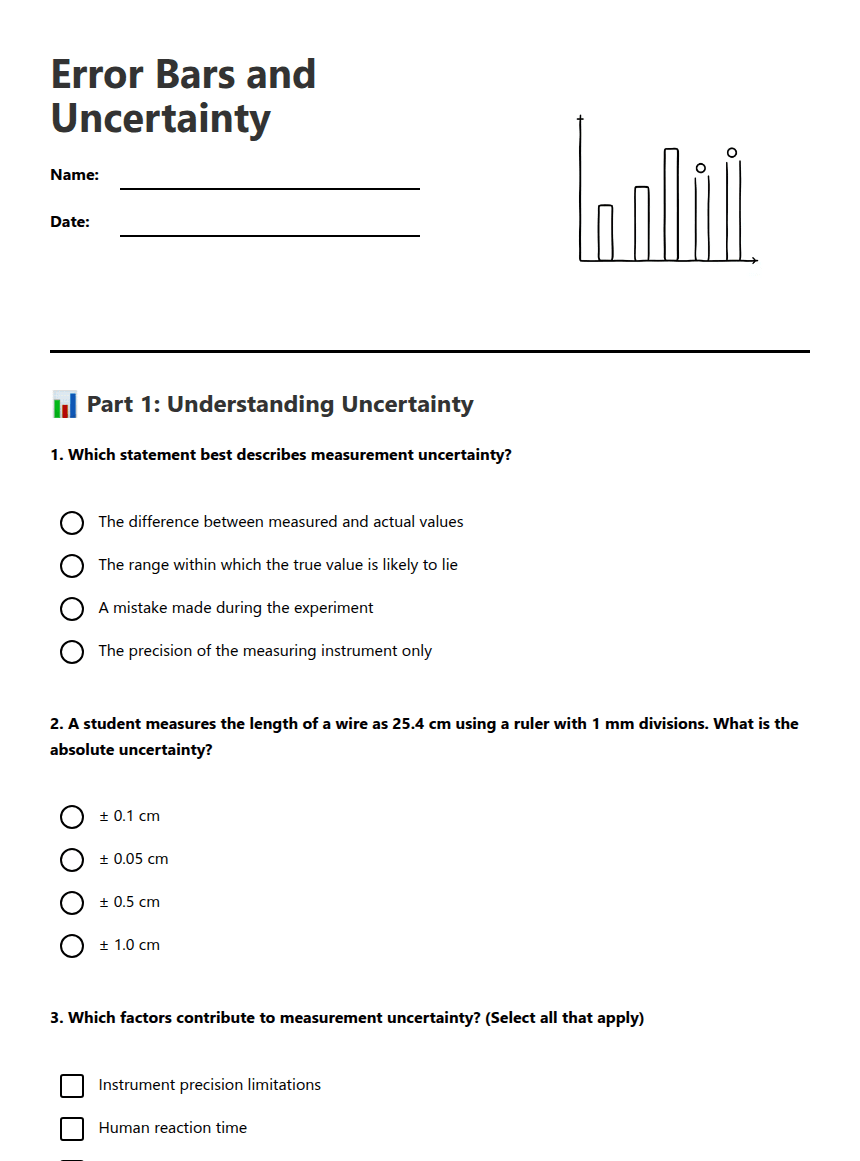
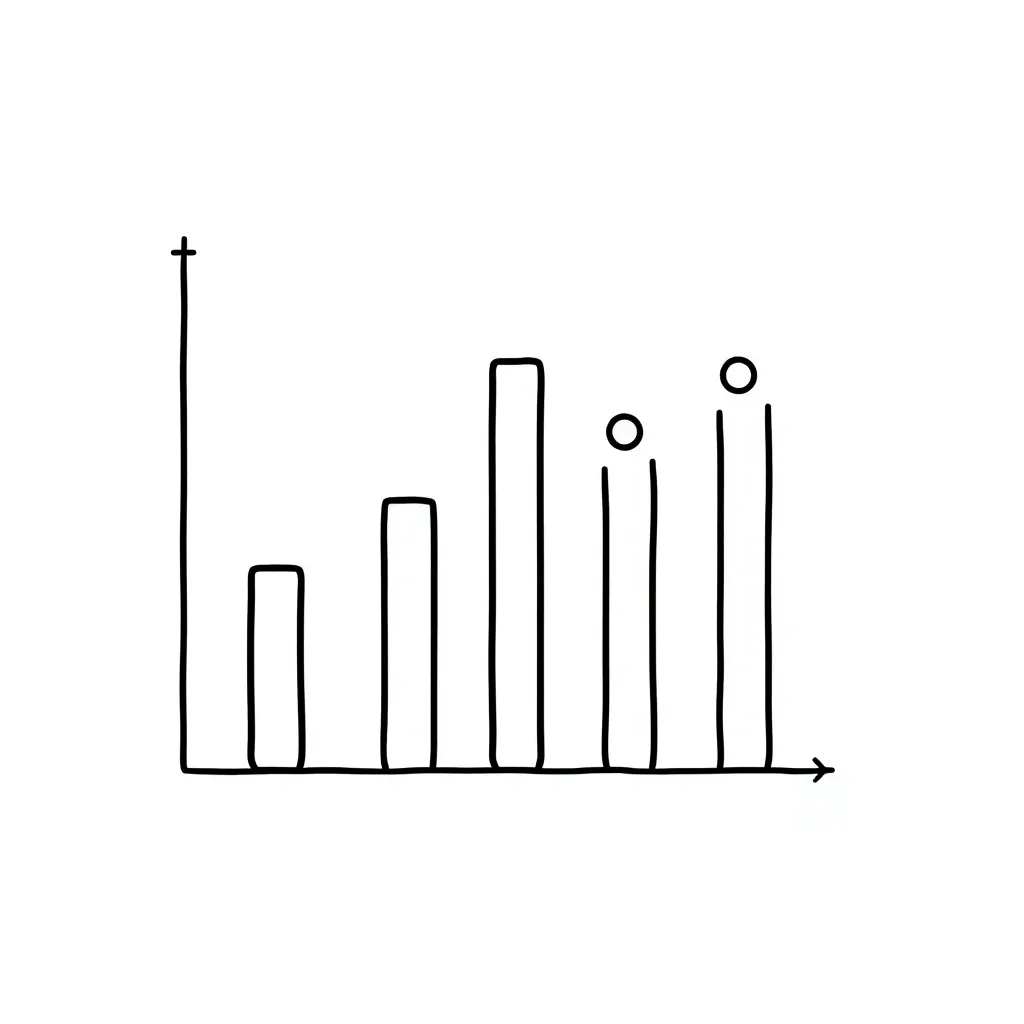
• (Data point at coordinates 5, 8)
About This Worksheet
Free in Kuraplan
Sign up free, grab the PDF, and customize it for your class.
Print-Ready
Formatted for standard paper. Clean layout, easy to read.
AI-Generated
Created with Kuraplan's AI, designed for real classroom use.
For Teachers & Parents
Use in classrooms, for homework, tutoring, or homeschool.
Need a custom version of this worksheet?
Kuraplan's AI generates custom worksheets in seconds — differentiated for every learner, aligned to your curriculum.
Generate Custom Worksheets — FreeMore Science Worksheets
Exercise and Respiration Investigation
Free
Material Properties Investigation
Free
Cells Experiment Observation Worksheet
Free
STEM Day Activity Guide
Free
Specific Heat Capacity Investigation
Free
Light Properties Investigation
Free
Wavelength and Frequency Investigation
Free