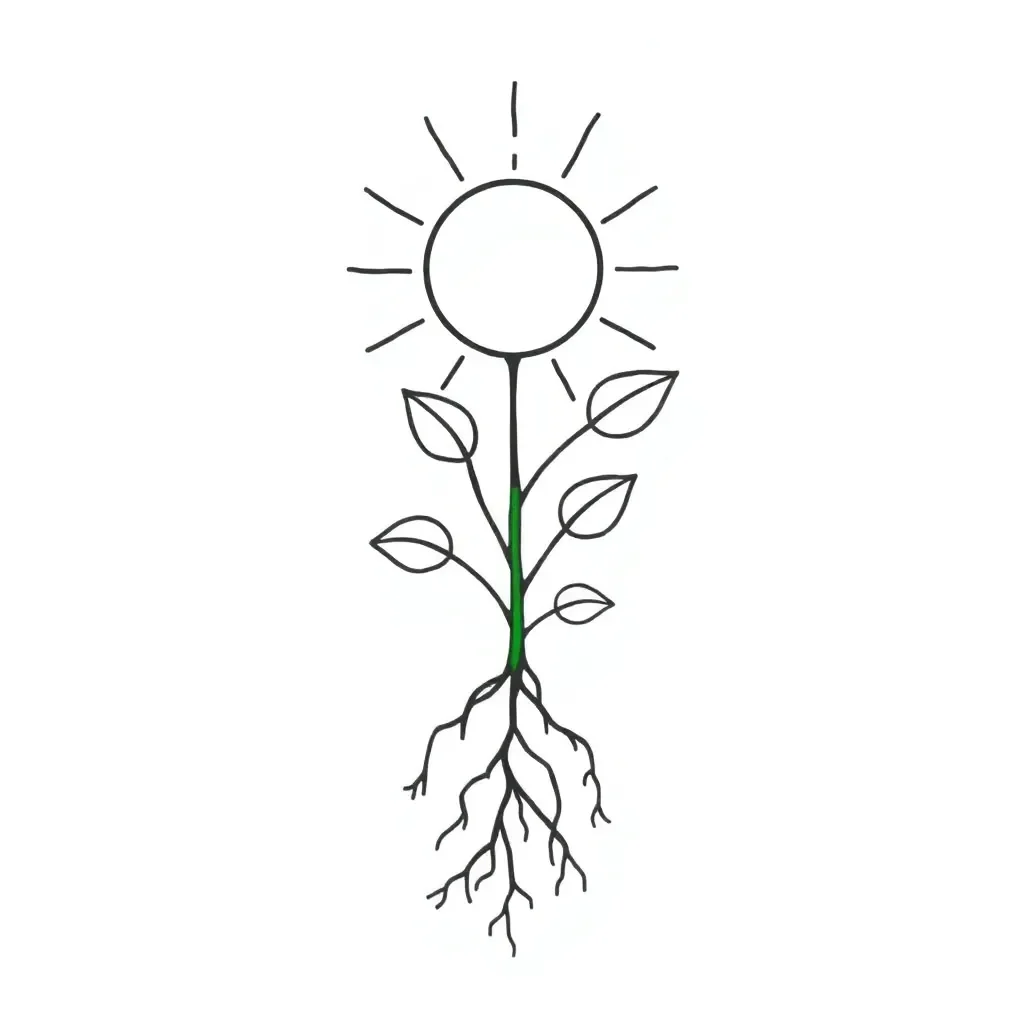
Light and Photosynthesis Lab
A free science worksheet ready for your classroom. Open in Kuraplan to grab the print-ready PDF, customize it for your students, or generate a fresh version in seconds.

Light and Photosynthesis Lab
🔬 Lab Overview & Goals
I can statements:
• I can design and carry out an experiment to test how light affects photosynthesis.
• I can collect and record data clearly and make a graph to show trends.
Success criteria:
• Follow steps safely and accurately. • Record bubble counts for two trials at each light level. • Create a simple line or bar graph of bubbles vs. light distance. • Explain results using scientific vocabulary.
Differentiation & supports:
• Dyslexia-friendly option: read instructions aloud and use large-print data table. • ELL support: sentence starters and key vocabulary provided. • Advanced students: design a follow-up test (color filters).
📚 Part 1: Multiple Choice & Matching (Choose one)
✏️ Part 2: Short Responses & Data Work
About This Worksheet
Free in Kuraplan
Sign up free, grab the PDF, and customize it for your class.
Print-Ready
Formatted for standard paper. Clean layout, easy to read.
AI-Generated
Created with Kuraplan's AI, designed for real classroom use.
For Teachers & Parents
Use in classrooms, for homework, tutoring, or homeschool.
Need a custom version of this worksheet?
Kuraplan's AI generates custom worksheets in seconds — differentiated for every learner, aligned to your curriculum.
Generate Custom Worksheets — FreeMore Science Worksheets
Variables in Science Investigations
Free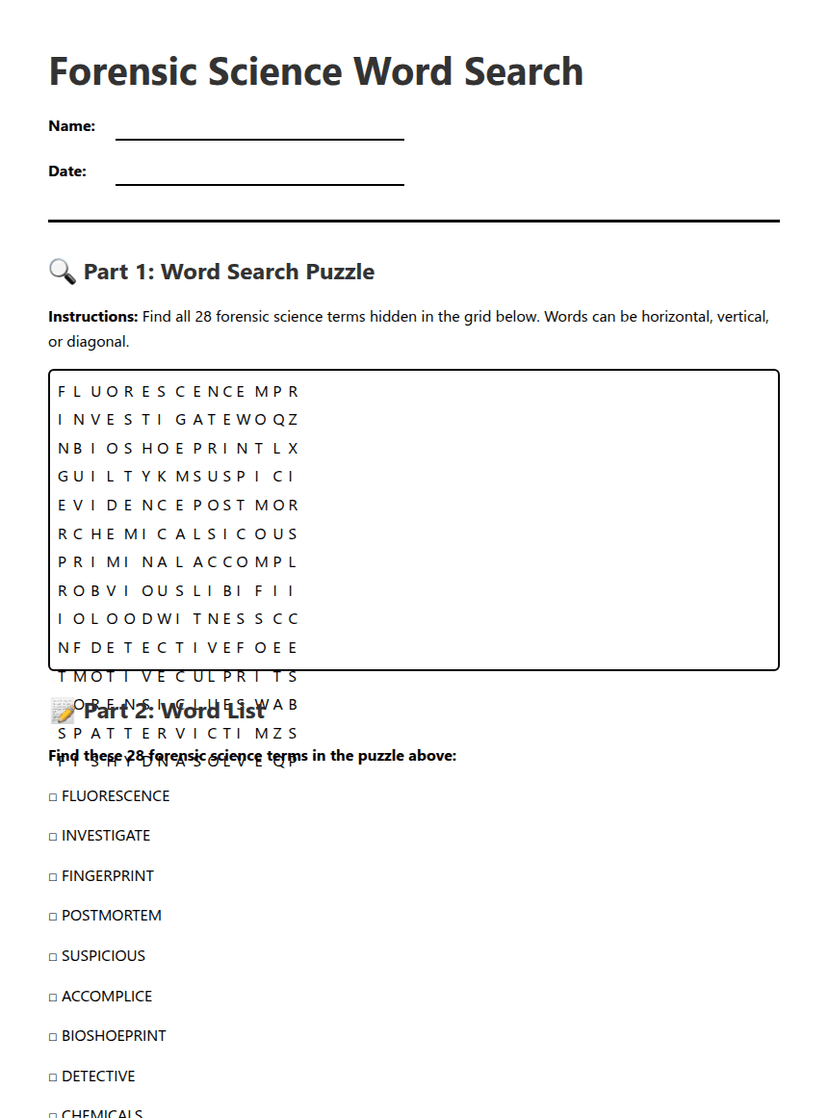
Forensic Science Word Search
Free
Science Observation Recording Sheet
Free
Science Objects Exploration
Free
Sports Science Introduction
Free
Senior Social Science Icebreaker
Free
What is Science?
Free