Weather Data and Fronts
A free science worksheet ready for your classroom. Open in Kuraplan to grab the print-ready PDF, customize it for your students, or generate a fresh version in seconds.
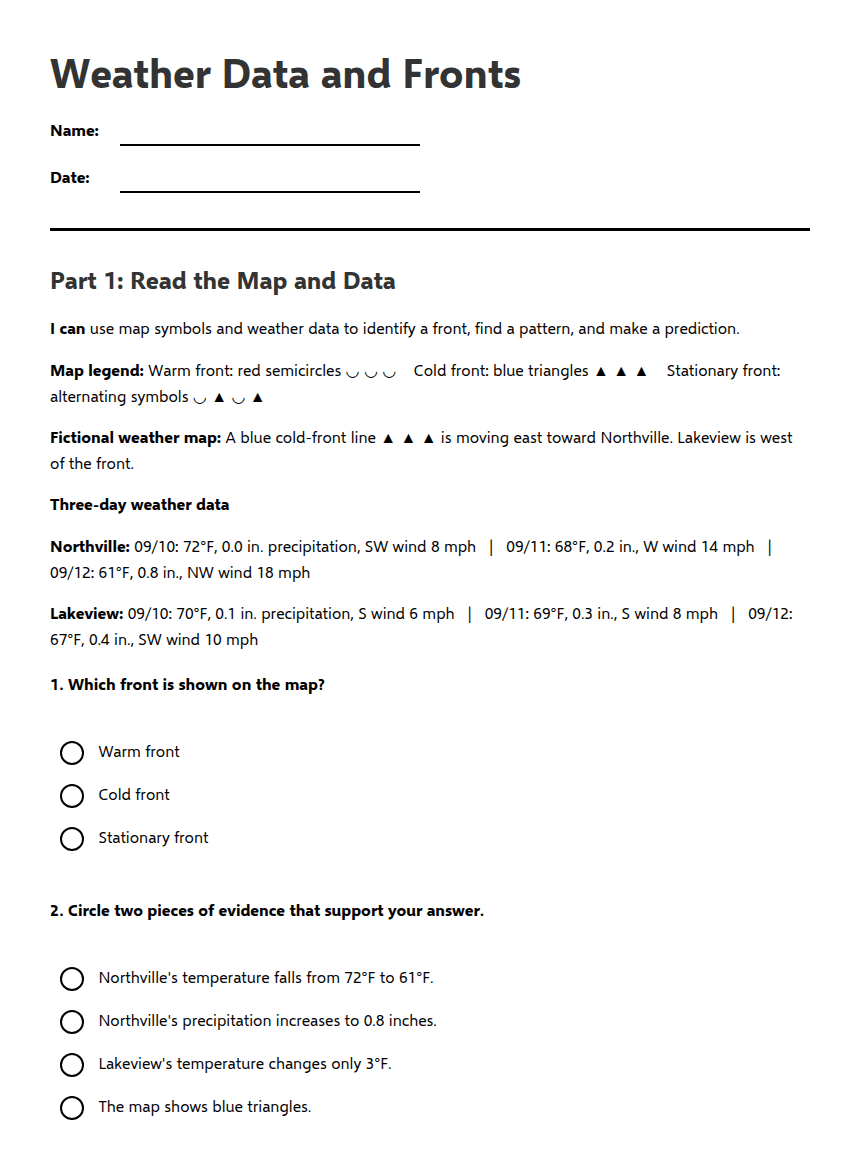
Weather Data and Fronts
Part 1: Read the Map and Data
I can use map symbols and weather data to identify a front, find a pattern, and make a prediction.
Map legend: Warm front: red semicircles ◡ ◡ ◡ Cold front: blue triangles ▲ ▲ ▲ Stationary front: alternating symbols ◡ ▲ ◡ ▲
Fictional weather map: A blue cold-front line ▲ ▲ ▲ is moving east toward Northville. Lakeview is west of the front.
Three-day weather data
Northville: 09/10: 72°F, 0.0 in. precipitation, SW wind 8 mph | 09/11: 68°F, 0.2 in., W wind 14 mph | 09/12: 61°F, 0.8 in., NW wind 18 mph
Lakeview: 09/10: 70°F, 0.1 in. precipitation, S wind 6 mph | 09/11: 69°F, 0.3 in., S wind 8 mph | 09/12: 67°F, 0.4 in., SW wind 10 mph
Part 2: Front Vocabulary Quiz
Word bank: warm front cold front stationary front temperature precipitation pattern
Success criteria: I can identify front symbols, compare weather measurements, use two pieces of evidence, and describe a weather pattern.
Helpful supports: Use the map legend, reread the data, and complete the sentence frame with two observations.
Challenge: Compare Northville and Lakeview. Which location changed more in temperature? Explain using data.
About This Worksheet
Free in Kuraplan
Sign up free, grab the PDF, and customize it for your class.
Print-Ready
Formatted for standard paper. Clean layout, easy to read.
AI-Generated
Created with Kuraplan's AI, designed for real classroom use.
For Teachers & Parents
Use in classrooms, for homework, tutoring, or homeschool.
Need a custom version of this worksheet?
Kuraplan's AI generates custom worksheets in seconds — differentiated for every learner, aligned to your curriculum.
Generate Custom Worksheets — Free