MathsFreePrintable

Ramp Distance Measurement Experiment

A free maths worksheet ready for your classroom. Open in Kuraplan to grab the print-ready PDF, customize it for your students, or generate a fresh version in seconds.
Ramp Distance Measurement Experiment worksheet preview
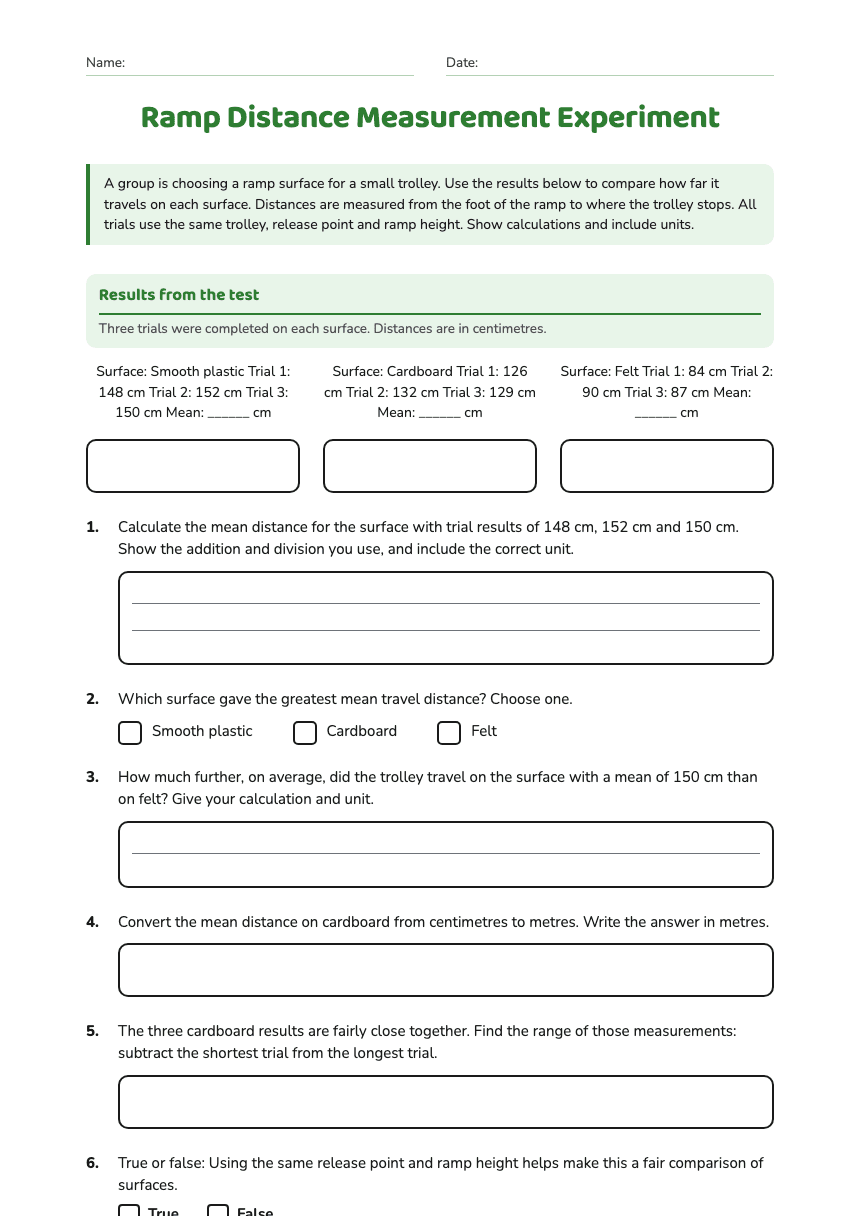
Name:Date:

Ramp Distance Measurement Experiment

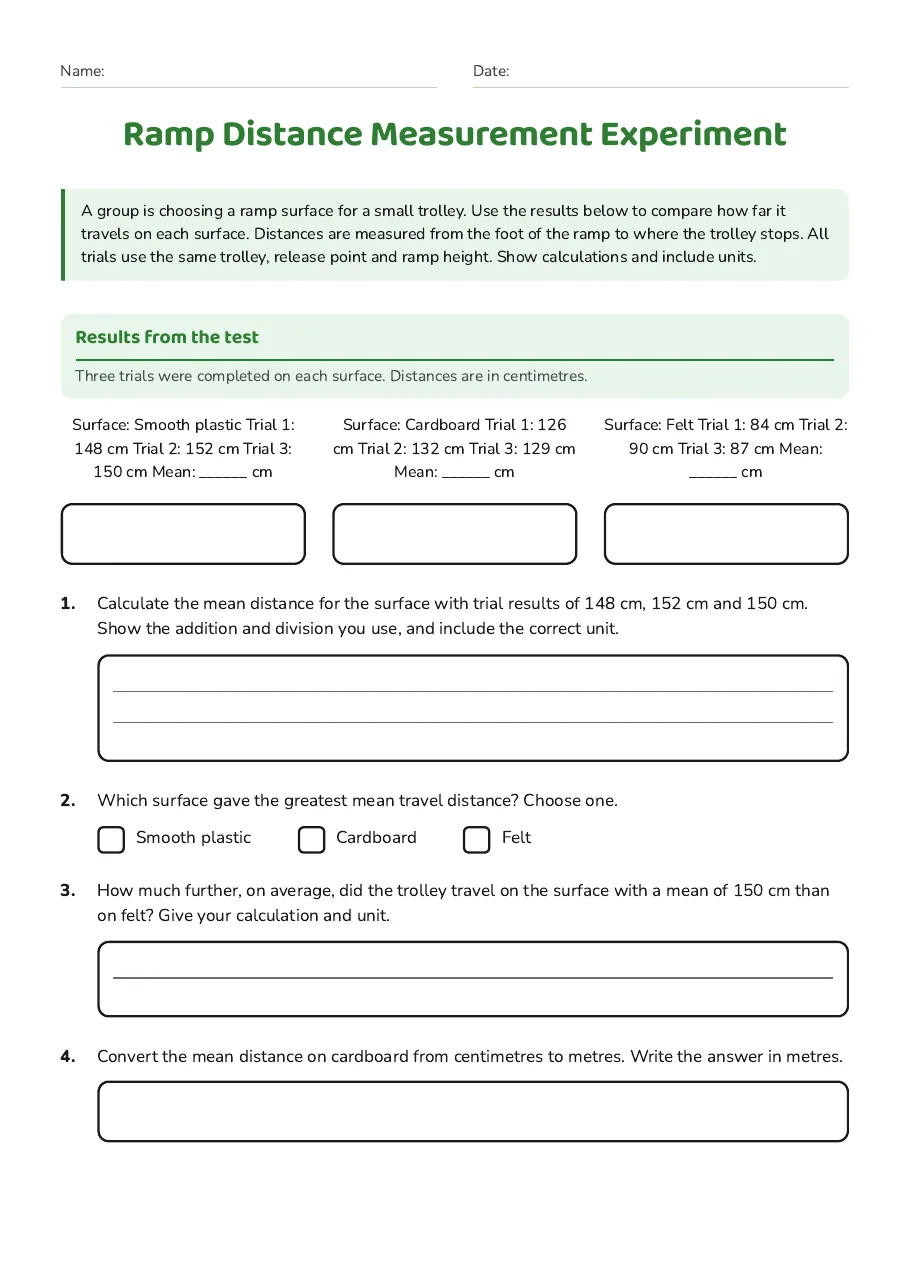
A group is choosing a ramp surface for a small trolley. Use the results below to compare how far it travels on each surface. Distances are measured from the foot of the ramp to where the trolley stops. All trials use the same trolley, release point and ramp height. Show calculations and include units.

Results from the test

Three trials were completed on each surface. Distances are in centimetres.

Surface: Smooth plastic Trial 1: 148 cm Trial 2: 152 cm Trial 3: 150 cm Mean: ______ cm

Surface: Cardboard Trial 1: 126 cm Trial 2: 132 cm Trial 3: 129 cm Mean: ______ cm

Surface: Felt Trial 1: 84 cm Trial 2: 90 cm Trial 3: 87 cm Mean: ______ cm

1.Calculate the mean distance for the surface with trial results of 148 cm, 152 cm and 150 cm. Show the addition and division you use, and include the correct unit.
2.Which surface gave the greatest mean travel distance? Choose one.
  • Smooth plastic
  • Cardboard
  • Felt
3.How much further, on average, did the trolley travel on the surface with a mean of 150 cm than on felt? Give your calculation and unit.
4.Convert the mean distance on cardboard from centimetres to metres. Write the answer in metres.
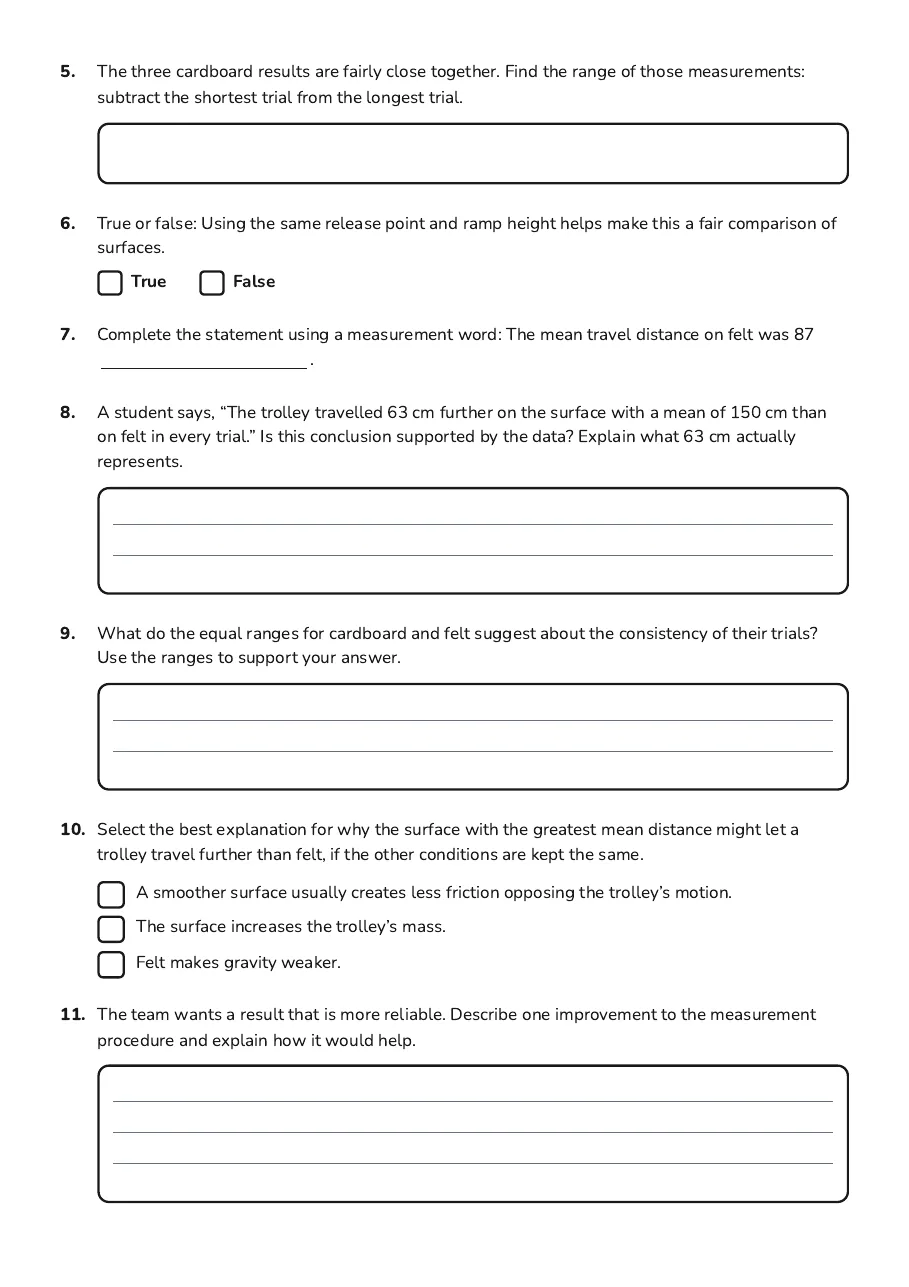
5.The three cardboard results are fairly close together. Find the range of those measurements: subtract the shortest trial from the longest trial.
6.True or false: Using the same release point and ramp height helps make this a fair comparison of surfaces.
TrueFalse
7.Complete the statement using a measurement word: The mean travel distance on felt was 87 .
8.A student says, “The trolley travelled 63 cm further on the surface with a mean of 150 cm than on felt in every trial.” Is this conclusion supported by the data? Explain what 63 cm actually represents.
9.What do the equal ranges for cardboard and felt suggest about the consistency of their trials? Use the ranges to support your answer.
10.Select the best explanation for why the surface with the greatest mean distance might let a trolley travel further than felt, if the other conditions are kept the same.
  • A smoother surface usually creates less friction opposing the trolley’s motion.
  • The surface increases the trolley’s mass.
  • Felt makes gravity weaker.
11.The team wants a result that is more reliable. Describe one improvement to the measurement procedure and explain how it would help.
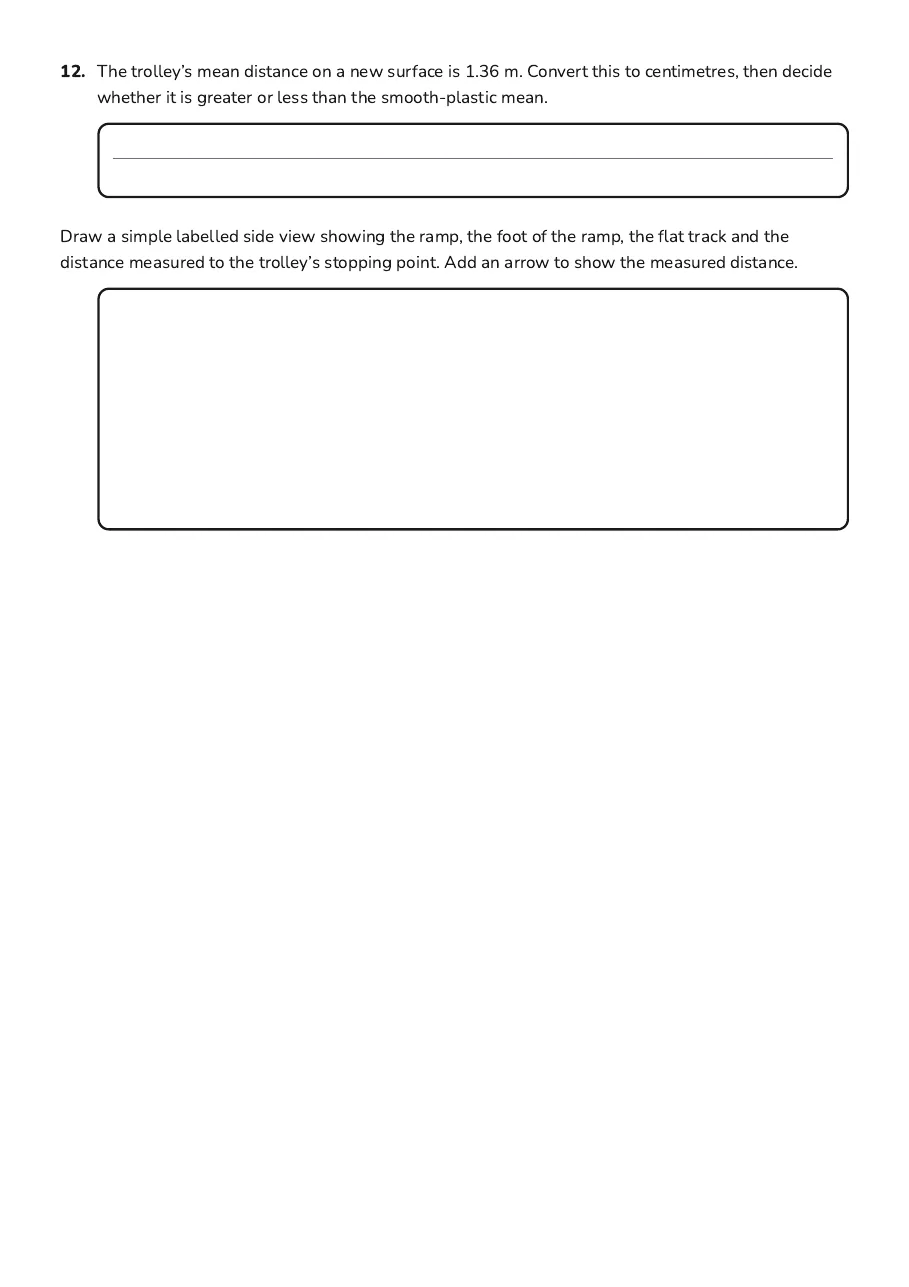
12.The trolley’s mean distance on a new surface is 1.36 m. Convert this to centimetres, then decide whether it is greater or less than the smooth-plastic mean.
Draw a simple labelled side view showing the ramp, the foot of the ramp, the flat track and the distance measured to the trolley’s stopping point. Add an arrow to show the measured distance.

3 printable pages

  • Ramp Distance Measurement Experiment, page 1 of 3: Results from the test

    Page 1

  • Ramp Distance Measurement Experiment, page 2 of 3: 5. The three cardboard results are fairly close together. Find the range of those…

    Page 2

  • Ramp Distance Measurement Experiment, page 3 of 3: 12. The trolley’s mean distance on a new surface is 1.36 m. Convert this to centimetres,…

    Page 3

About This Worksheet

Free in Kuraplan

Sign up free, grab the PDF, and customize it for your class.

Print-Ready

Formatted for standard paper. Clean layout, easy to read.

AI-Generated

Created with Kuraplan's AI, designed for real classroom use.

For Teachers & Parents

Use in classrooms, for homework, tutoring, or homeschool.

Need a custom version of this worksheet?

Kuraplan's AI generates custom worksheets in seconds — differentiated for every learner, aligned to your curriculum.

Generate Custom Worksheets — Free
No credit card Curriculum-aligned Under 60 seconds