ScienceFreePrintable

Speed and Motion Investigation

A free science worksheet ready for your classroom. Open in Kuraplan to grab the print-ready PDF, customize it for your students, or generate a fresh version in seconds.
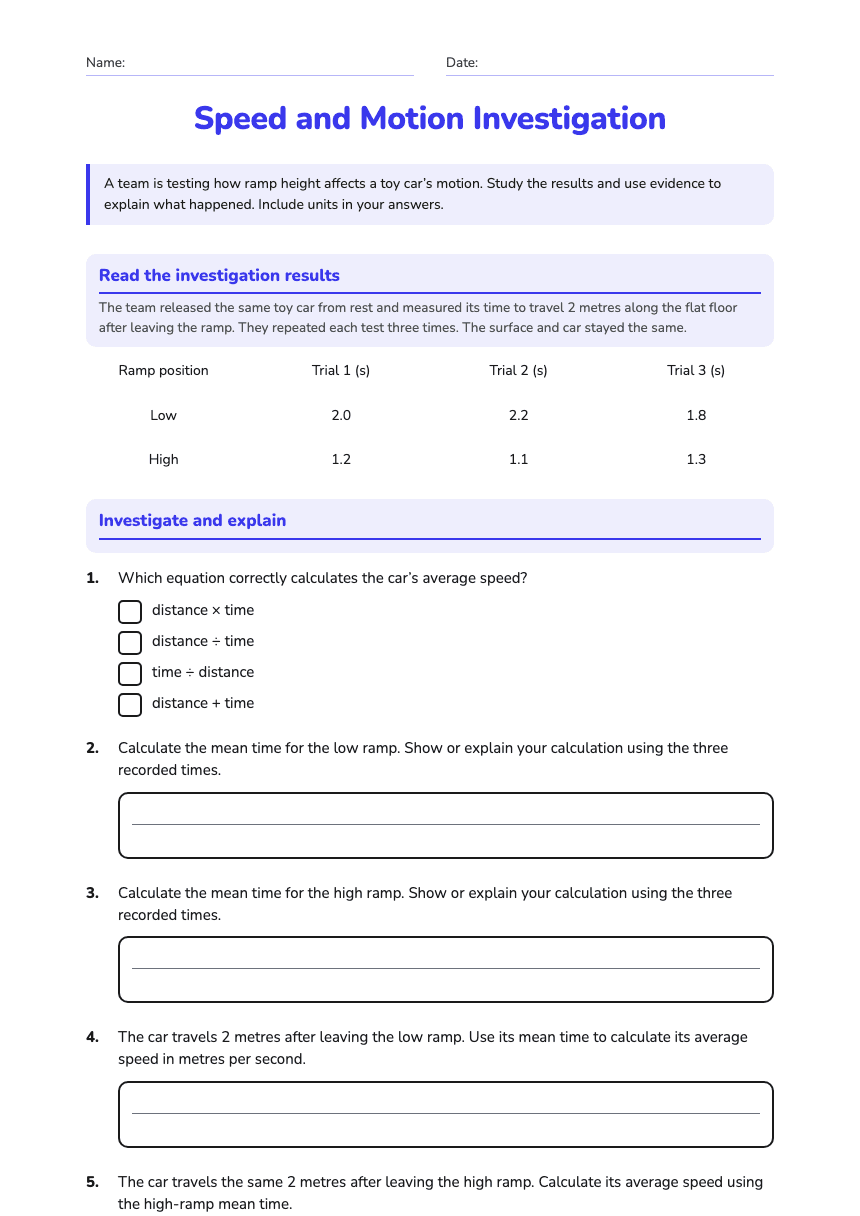
Speed and Motion Investigation worksheet preview
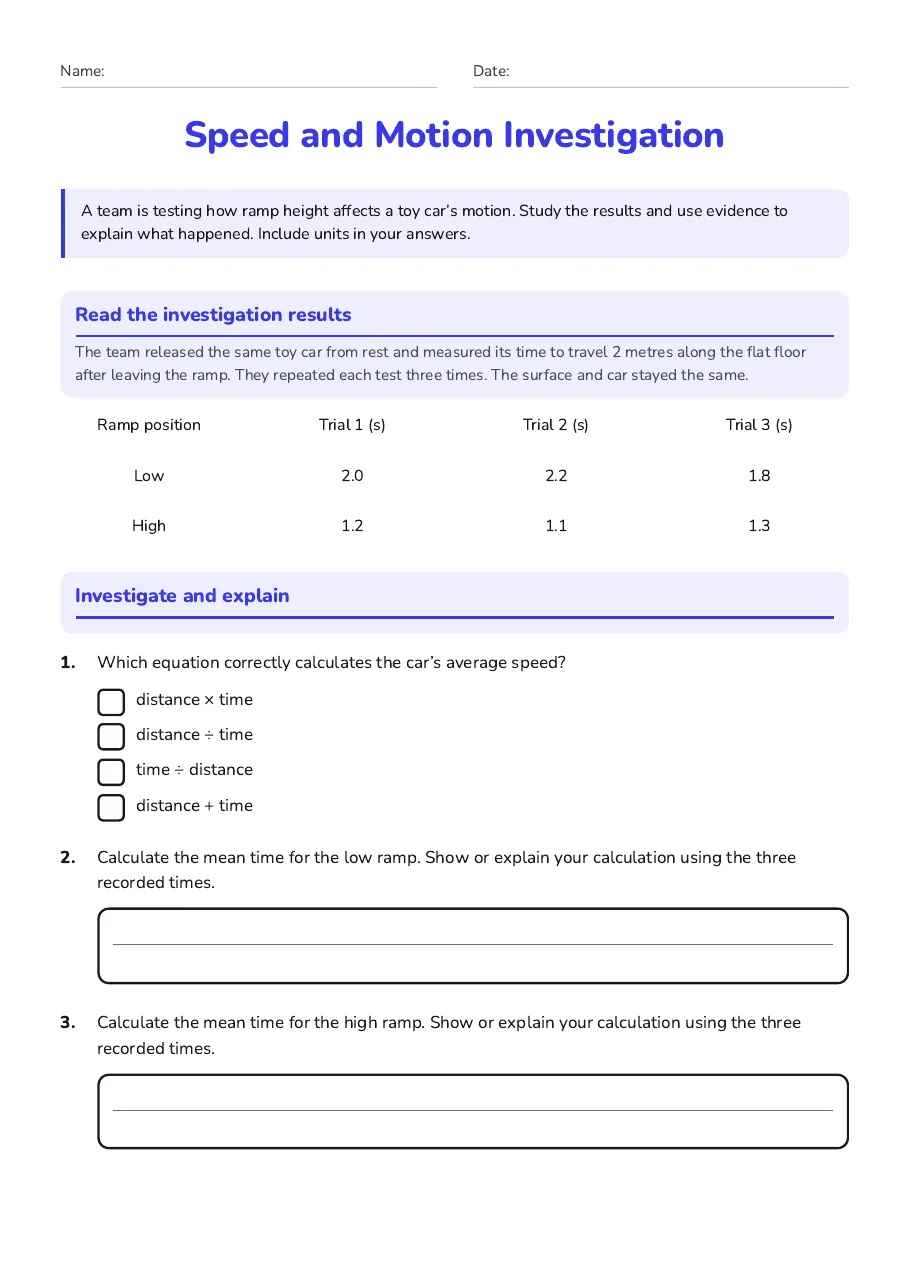
Name:Date:

Speed and Motion Investigation

A team is testing how ramp height affects a toy car’s motion. Study the results and use evidence to explain what happened. Include units in your answers.

Read the investigation results

The team released the same toy car from rest and measured its time to travel 2 metres along the flat floor after leaving the ramp. They repeated each test three times. The surface and car stayed the same.

Ramp position

Trial 1 (s)

Trial 2 (s)

Trial 3 (s)

Low

2.0

2.2

1.8

High

1.2

1.1

1.3

Investigate and explain

1.Which equation correctly calculates the car’s average speed?
  • distance × time
  • distance ÷ time
  • time ÷ distance
  • distance + time
2.Calculate the mean time for the low ramp. Show or explain your calculation using the three recorded times.
3.Calculate the mean time for the high ramp. Show or explain your calculation using the three recorded times.
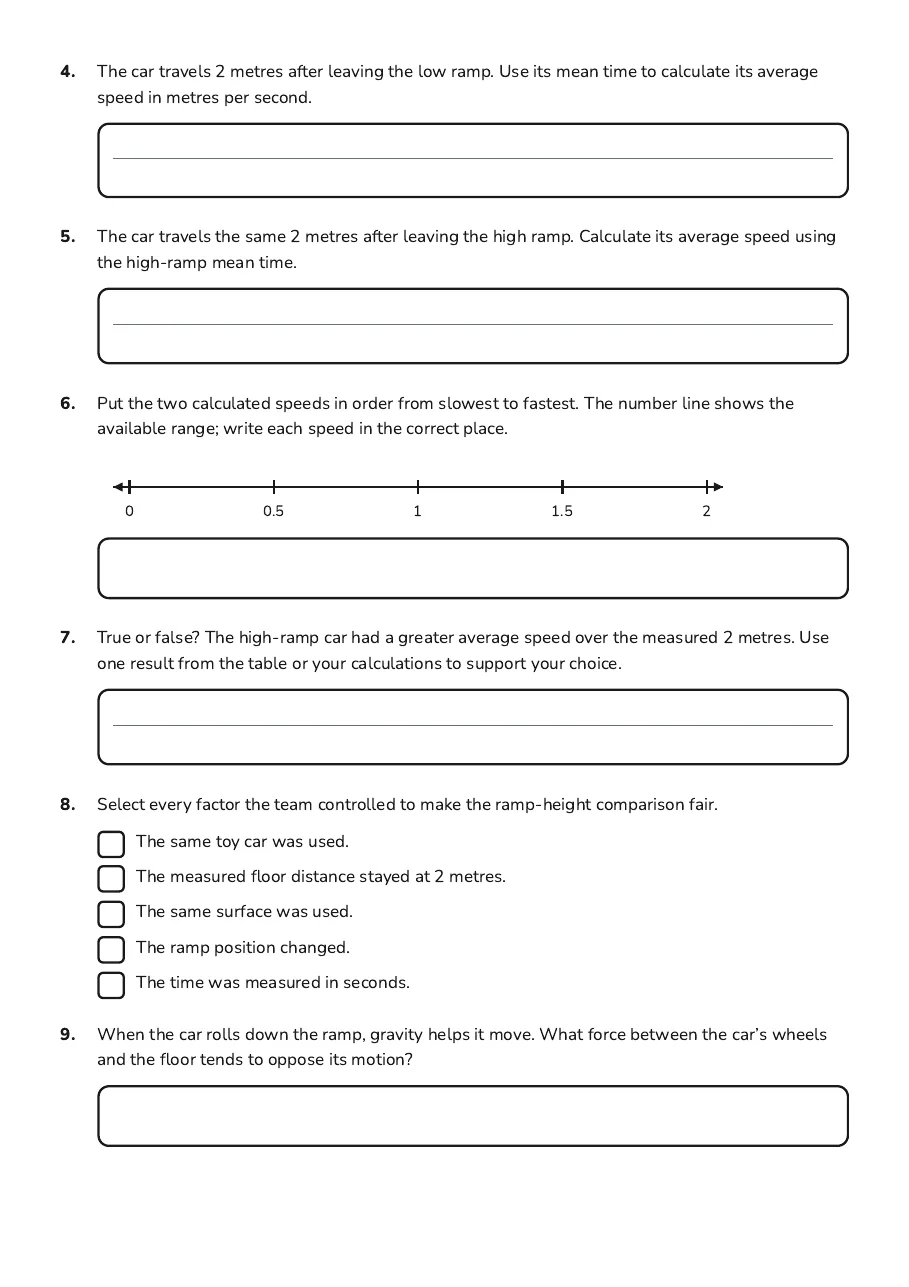
4.The car travels 2 metres after leaving the low ramp. Use its mean time to calculate its average speed in metres per second.
5.The car travels the same 2 metres after leaving the high ramp. Calculate its average speed using the high-ramp mean time.
6.Put the two calculated speeds in order from slowest to fastest. The number line shows the available range; write each speed in the correct place.
00.511.52
7.True or false? The high-ramp car had a greater average speed over the measured 2 metres. Use one result from the table or your calculations to support your choice.
8.Select every factor the team controlled to make the ramp-height comparison fair.
  • The same toy car was used.
  • The measured floor distance stayed at 2 metres.
  • The same surface was used.
  • The ramp position changed.
  • The time was measured in seconds.
9.When the car rolls down the ramp, gravity helps it move. What force between the car’s wheels and the floor tends to oppose its motion?
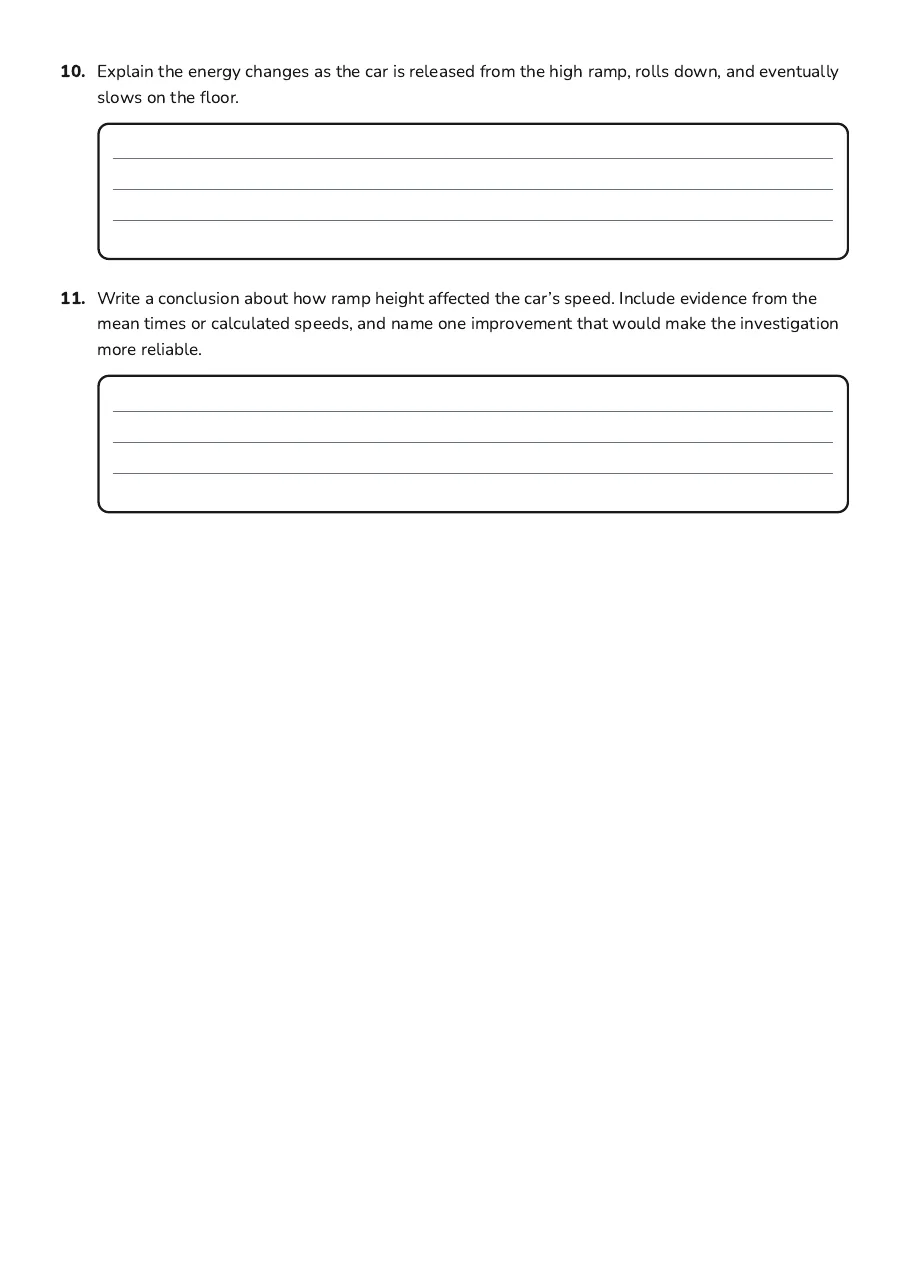
10.Explain the energy changes as the car is released from the high ramp, rolls down, and eventually slows on the floor.
11.Write a conclusion about how ramp height affected the car’s speed. Include evidence from the mean times or calculated speeds, and name one improvement that would make the investigation more reliable.

3 printable pages

  • Speed and Motion Investigation, page 1 of 3: Read the investigation results, Investigate and explain

    Page 1

  • Speed and Motion Investigation, page 2 of 3: 4. The car travels 2 metres after leaving the low ramp. Use its mean time to calculate…

    Page 2

  • Speed and Motion Investigation, page 3 of 3: 10. Explain the energy changes as the car is released from the high ramp, rolls down, and…

    Page 3

About This Worksheet

Free in Kuraplan

Sign up free, grab the PDF, and customize it for your class.

Print-Ready

Formatted for standard paper. Clean layout, easy to read.

AI-Generated

Created with Kuraplan's AI, designed for real classroom use.

For Teachers & Parents

Use in classrooms, for homework, tutoring, or homeschool.

Need a custom version of this worksheet?

Kuraplan's AI generates custom worksheets in seconds — differentiated for every learner, aligned to your curriculum.

Generate Custom Worksheets — Free
No credit card Curriculum-aligned Under 60 seconds