MathsFreePrintable

Central Tendency Measures

A free maths worksheet ready for your classroom. Open in Kuraplan to grab the print-ready PDF, customize it for your students, or generate a fresh version in seconds.
Central Tendency Measures worksheet preview
Name:Date:

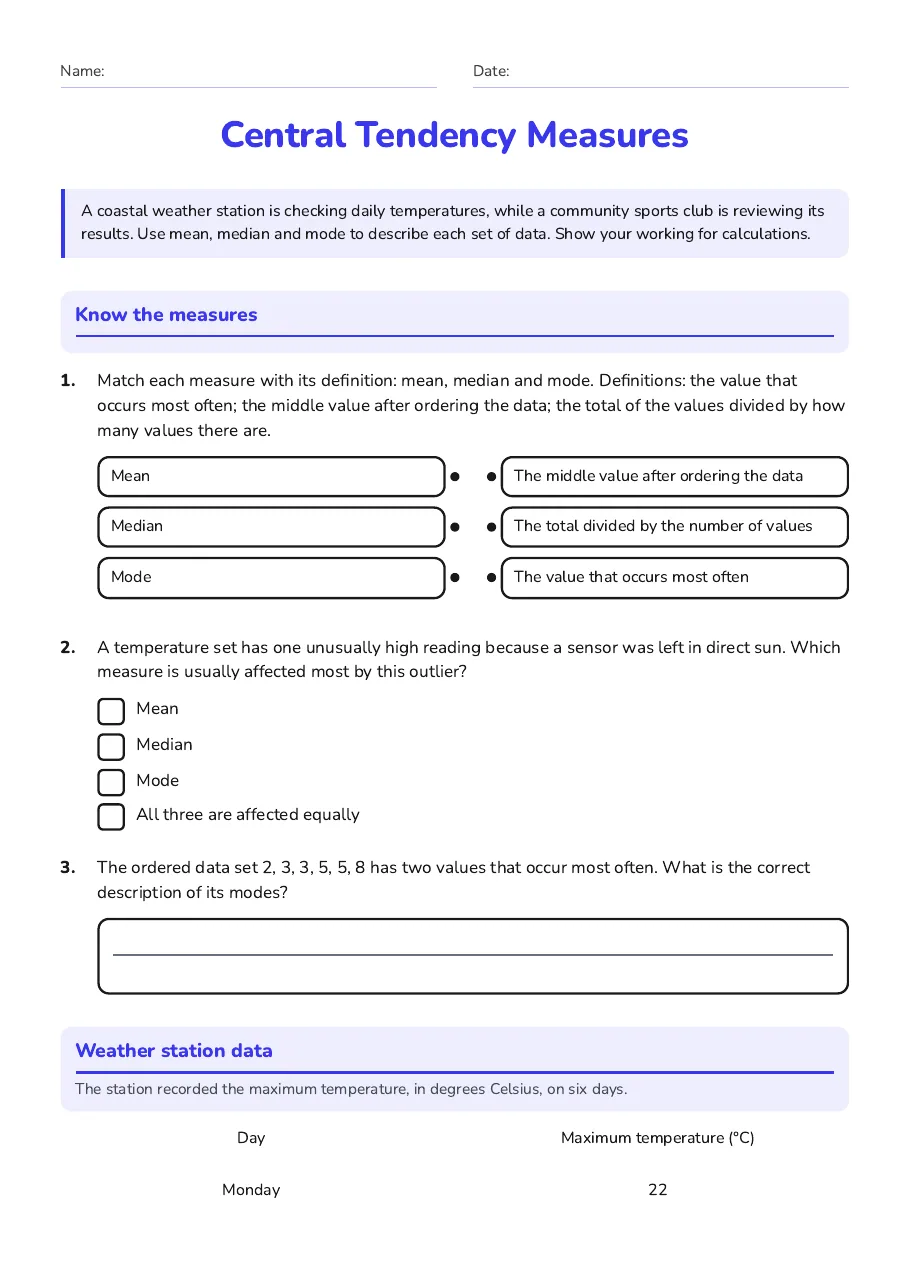
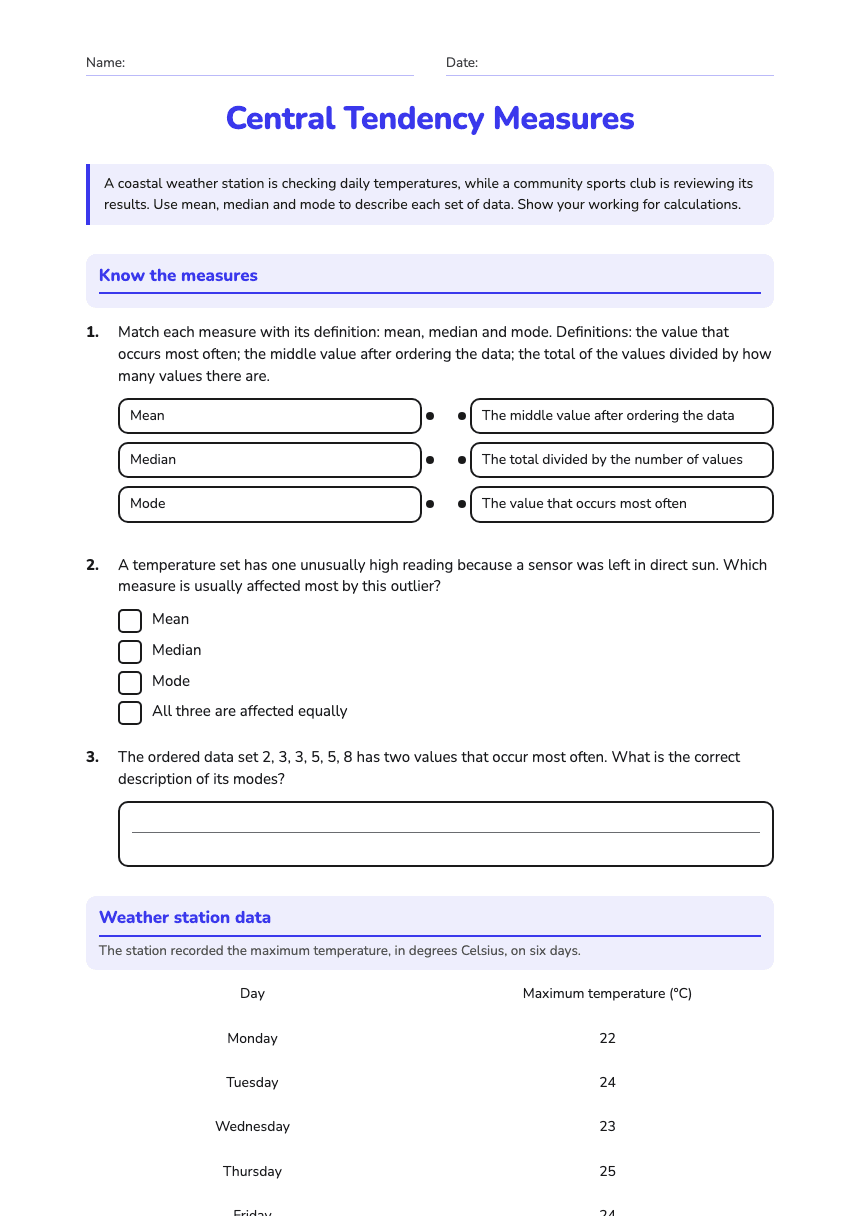
Central Tendency Measures

A coastal weather station is checking daily temperatures, while a community sports club is reviewing its results. Use mean, median and mode to describe each set of data. Show your working for calculations.

Know the measures

1.Match each measure with its definition: mean, median and mode. Definitions: the value that occurs most often; the middle value after ordering the data; the total of the values divided by how many values there are.
  • Mean
  • Median
  • Mode
  • The middle value after ordering the data
  • The total divided by the number of values
  • The value that occurs most often
2.A temperature set has one unusually high reading because a sensor was left in direct sun. Which measure is usually affected most by this outlier?
  • Mean
  • Median
  • Mode
  • All three are affected equally
3.The ordered data set 2, 3, 3, 5, 5, 8 has two values that occur most often. What is the correct description of its modes?

Weather station data

The station recorded the maximum temperature, in degrees Celsius, on six days.

Day

Maximum temperature (°C)

Monday

22

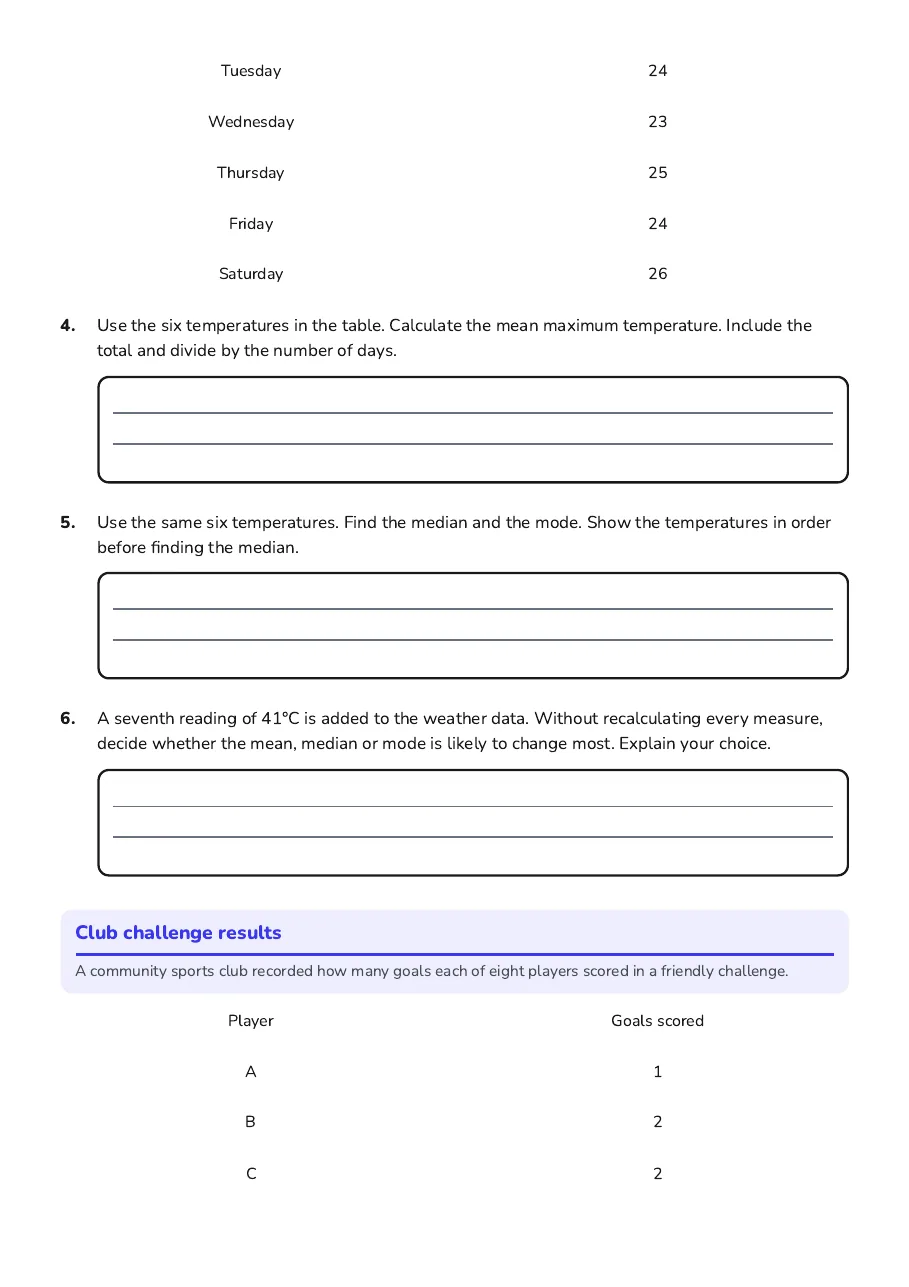
Tuesday

24

Wednesday

23

Thursday

25

Friday

24

Saturday

26

4.Use the six temperatures in the table. Calculate the mean maximum temperature. Include the total and divide by the number of days.
5.Use the same six temperatures. Find the median and the mode. Show the temperatures in order before finding the median.
6.A seventh reading of 41°C is added to the weather data. Without recalculating every measure, decide whether the mean, median or mode is likely to change most. Explain your choice.

Club challenge results

A community sports club recorded how many goals each of eight players scored in a friendly challenge.

Player

Goals scored

A

1

B

2

C

2

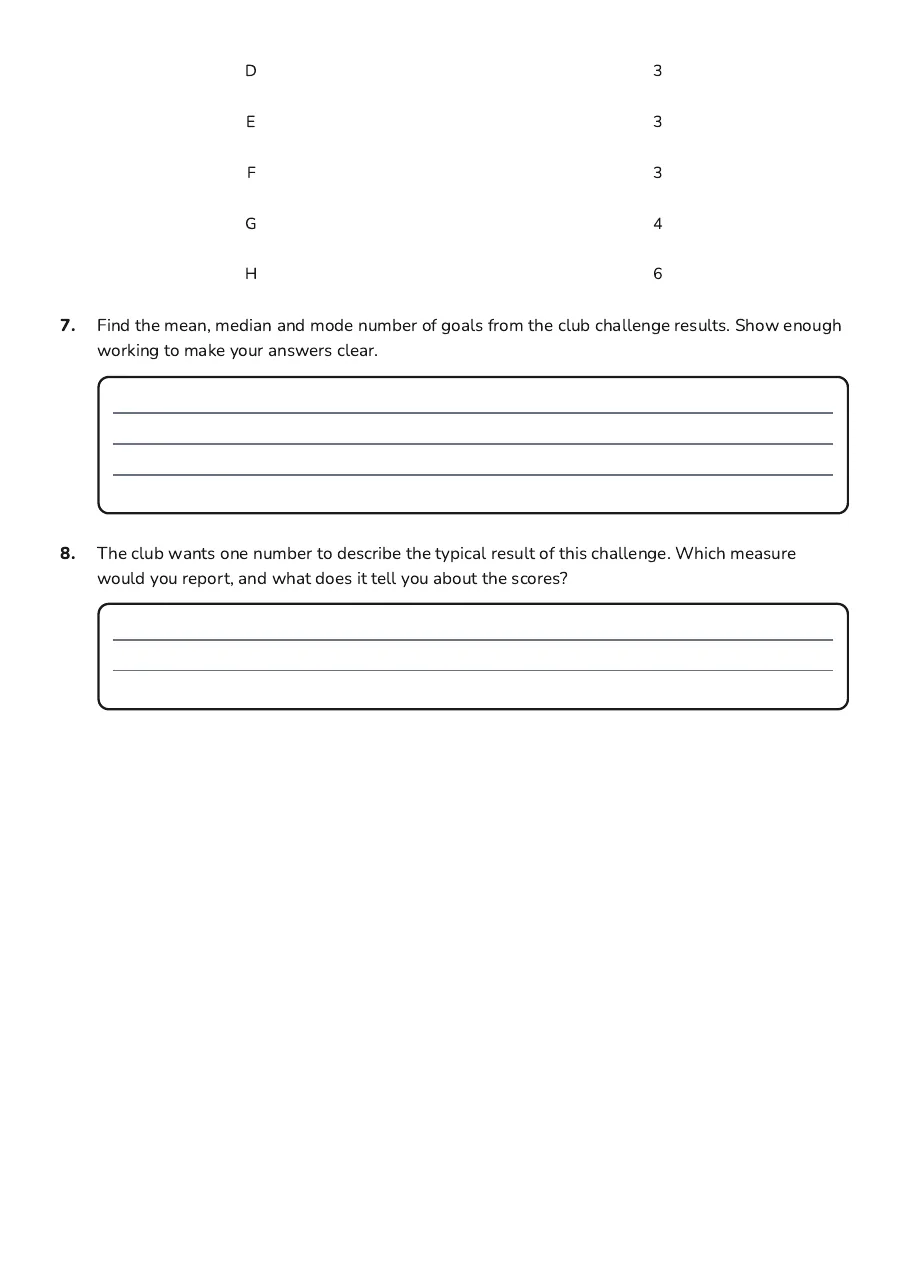
D

3

E

3

F

3

G

4

H

6

7.Find the mean, median and mode number of goals from the club challenge results. Show enough working to make your answers clear.
8.The club wants one number to describe the typical result of this challenge. Which measure would you report, and what does it tell you about the scores?

3 printable pages

  • Central Tendency Measures, page 1 of 3: Know the measures, Weather station data

    Page 1

  • Central Tendency Measures, page 2 of 3: Club challenge results

    Page 2

  • Central Tendency Measures, page 3 of 3: D 3

    Page 3

About This Worksheet

Free in Kuraplan

Sign up free, grab the PDF, and customize it for your class.

Print-Ready

Formatted for standard paper. Clean layout, easy to read.

AI-Generated

Created with Kuraplan's AI, designed for real classroom use.

For Teachers & Parents

Use in classrooms, for homework, tutoring, or homeschool.

Need a custom version of this worksheet?

Kuraplan's AI generates custom worksheets in seconds — differentiated for every learner, aligned to your curriculum.

Generate Custom Worksheets — Free
No credit card Curriculum-aligned Under 60 seconds