MathsFreePrintable
Creating Data Graphs
A free maths worksheet ready for your classroom. Open in Kuraplan to grab the print-ready PDF, customize it for your students, or generate a fresh version in seconds.
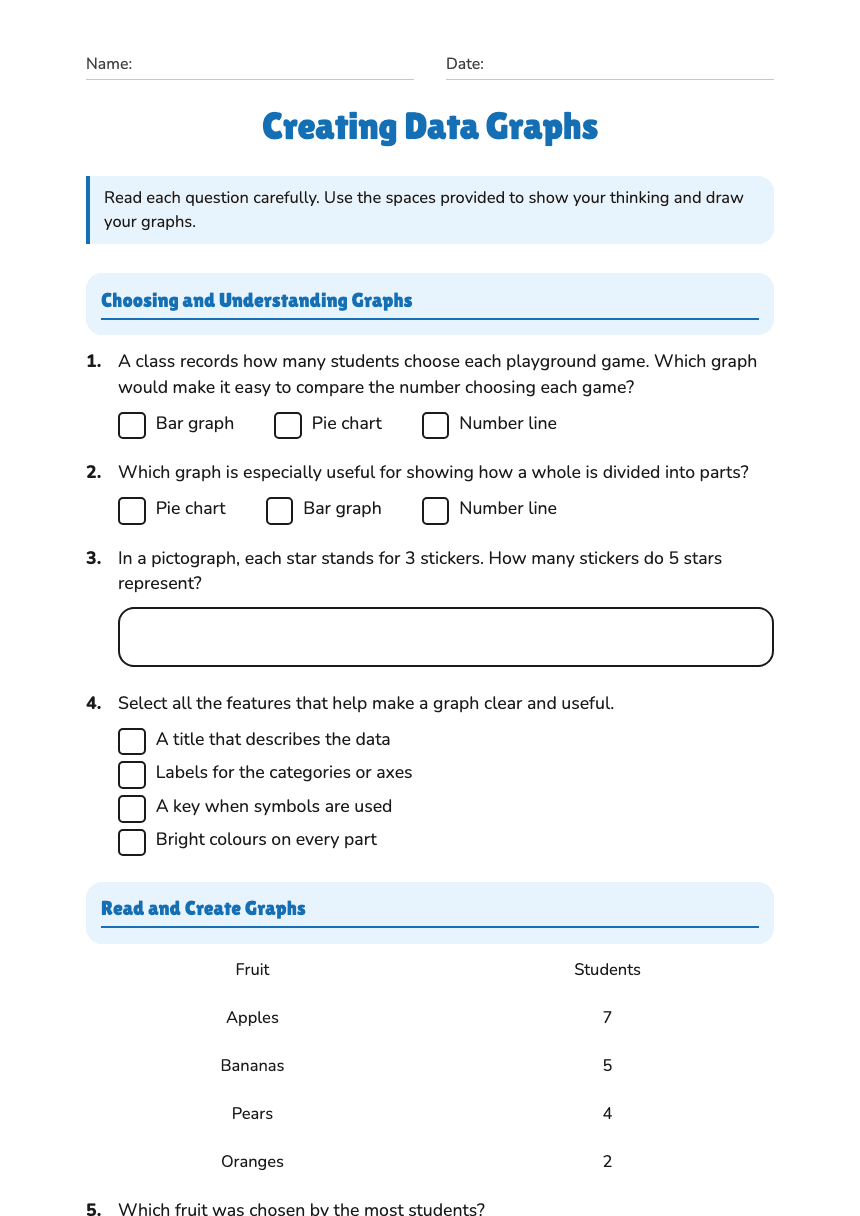
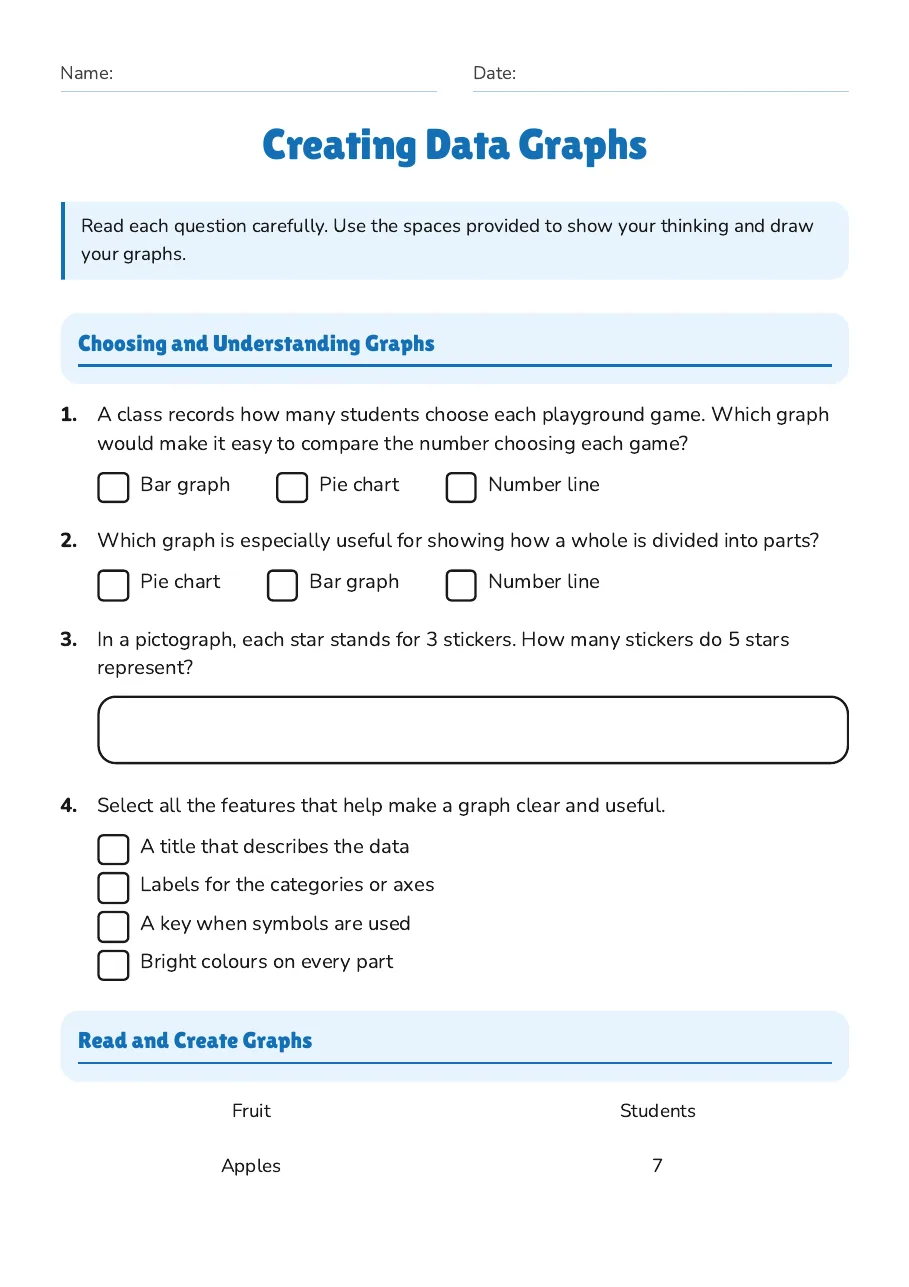
Name:Date:
Creating Data Graphs
Read each question carefully. Use the spaces provided to show your thinking and draw your graphs.
Choosing and Understanding Graphs
1.A class records how many students choose each playground game. Which graph would make it easy to compare the number choosing each game?
- Bar graph
- Pie chart
- Number line
2.Which graph is especially useful for showing how a whole is divided into parts?
- Pie chart
- Bar graph
- Number line
3.In a pictograph, each star stands for 3 stickers. How many stickers do 5 stars represent?
4.Select all the features that help make a graph clear and useful.
- A title that describes the data
- Labels for the categories or axes
- A key when symbols are used
- Bright colours on every part
Read and Create Graphs
Fruit
Students
Apples
7
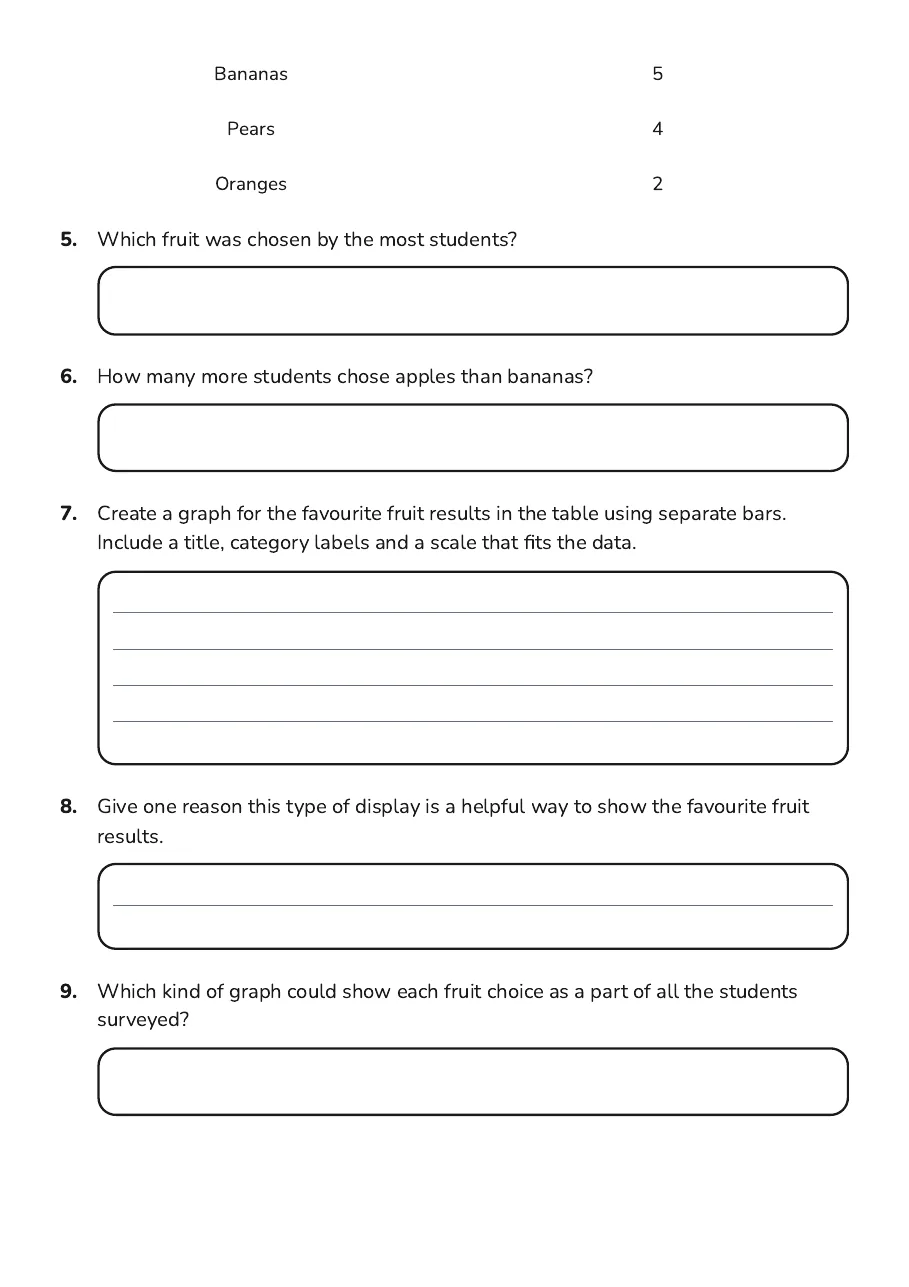
Bananas
5
Pears
4
Oranges
2
5.Which fruit was chosen by the most students?
6.How many more students chose apples than bananas?
7.Create a graph for the favourite fruit results in the table using separate bars. Include a title, category labels and a scale that fits the data.
8.Give one reason this type of display is a helpful way to show the favourite fruit results.
9.Which kind of graph could show each fruit choice as a part of all the students surveyed?
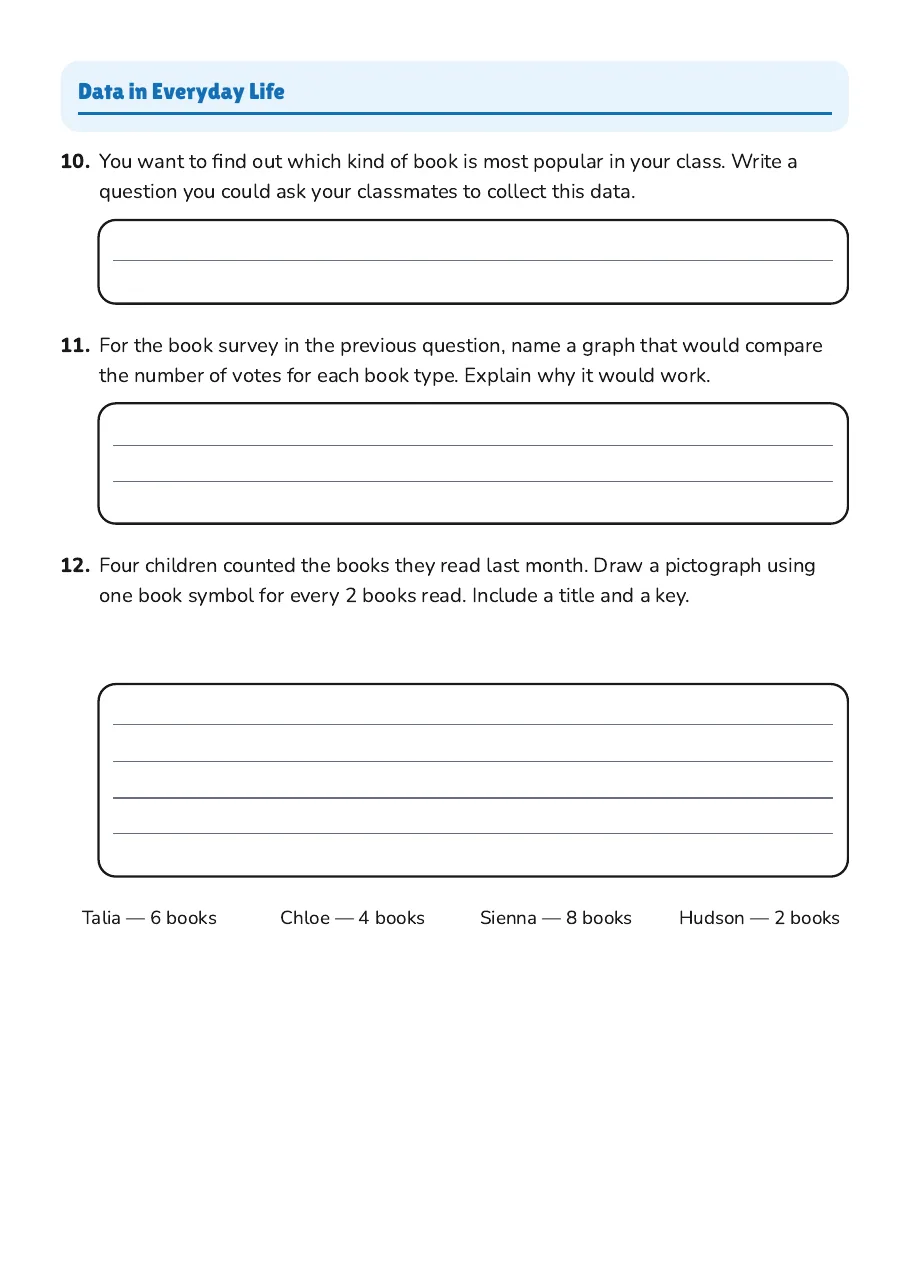
Data in Everyday Life
10.You want to find out which kind of book is most popular in your class. Write a question you could ask your classmates to collect this data.
11.For the book survey in the previous question, name a graph that would compare the number of votes for each book type. Explain why it would work.
12.Four children counted the books they read last month. Draw a pictograph using one book symbol for every 2 books read. Include a title and a key.
Talia — 6 books
Chloe — 4 books
Sienna — 8 books
Hudson — 2 books
3 printable pages
Page 1
Page 2
Page 3
About This Worksheet
Free in Kuraplan
Sign up free, grab the PDF, and customize it for your class.
Print-Ready
Formatted for standard paper. Clean layout, easy to read.
AI-Generated
Created with Kuraplan's AI, designed for real classroom use.
For Teachers & Parents
Use in classrooms, for homework, tutoring, or homeschool.
Need a custom version of this worksheet?
Kuraplan's AI generates custom worksheets in seconds — differentiated for every learner, aligned to your curriculum.
Generate Custom Worksheets — Free No credit card Curriculum-aligned Under 60 seconds