MathsFreePrintable

Data Analysis Worksheet

A free maths worksheet ready for your classroom. Open in Kuraplan to grab the print-ready PDF, customize it for your students, or generate a fresh version in seconds.
Data Analysis Worksheet worksheet preview
Name:Date:

Data Analysis Worksheet

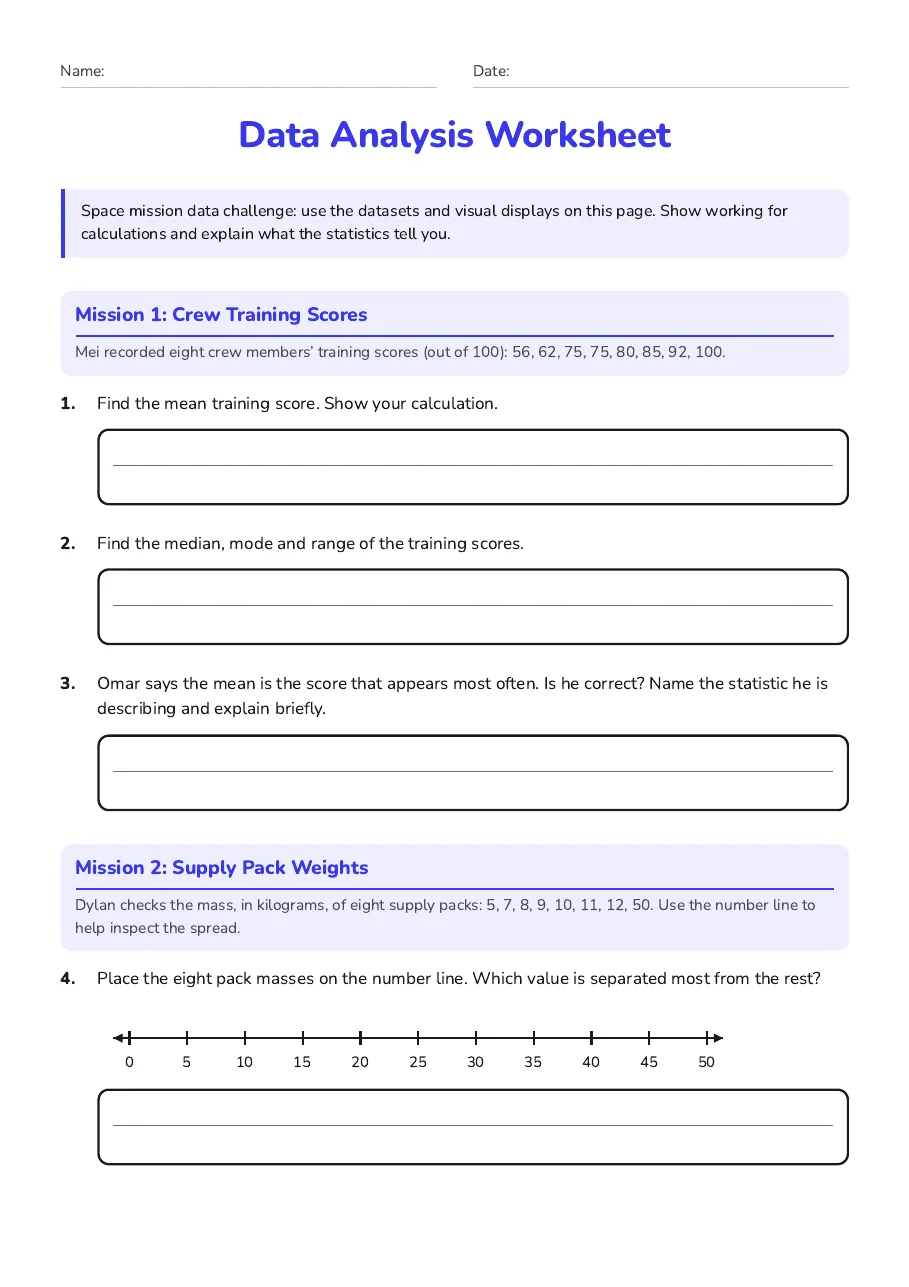
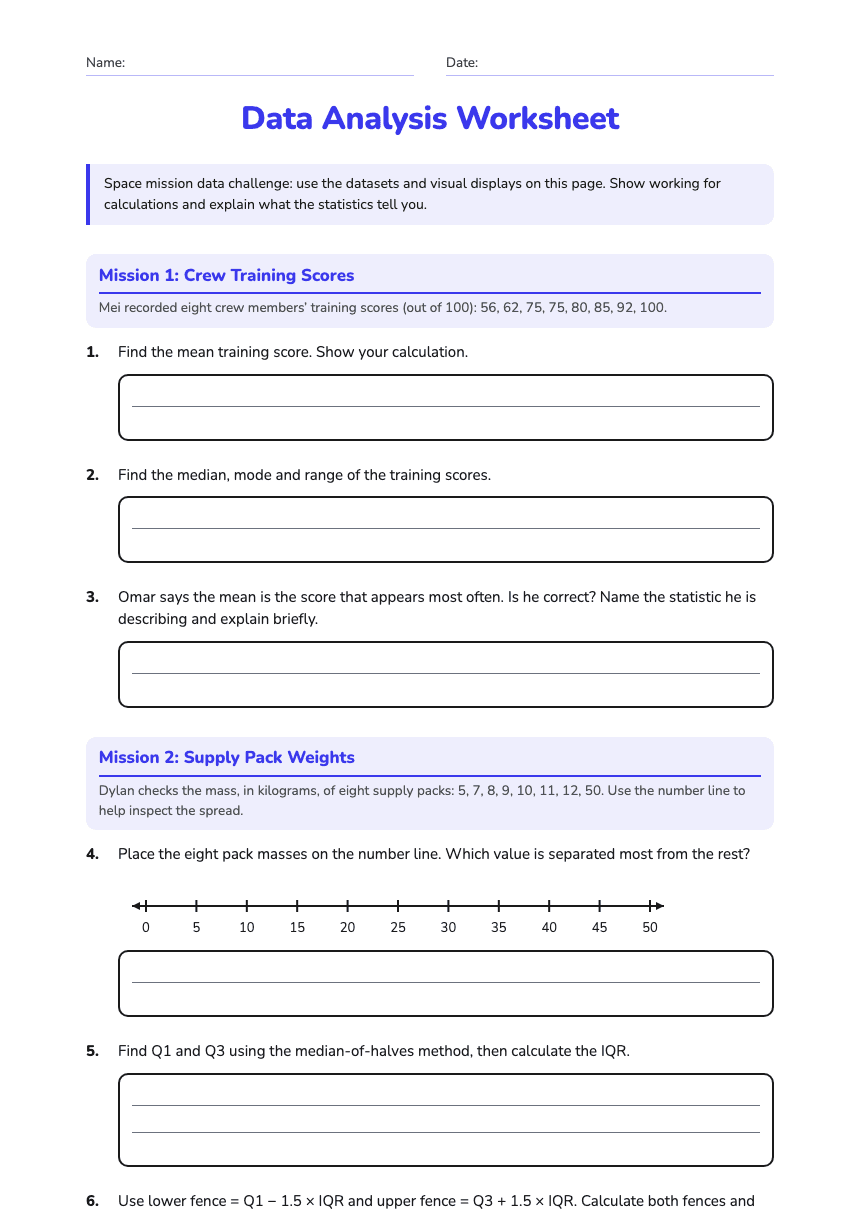
Space mission data challenge: use the datasets and visual displays on this page. Show working for calculations and explain what the statistics tell you.

Mission 1: Crew Training Scores

Mei recorded eight crew members’ training scores (out of 100): 56, 62, 75, 75, 80, 85, 92, 100.

1.Find the mean training score. Show your calculation.
2.Find the median, mode and range of the training scores.
3.Omar says the mean is the score that appears most often. Is he correct? Name the statistic he is describing and explain briefly.

Mission 2: Supply Pack Weights

Dylan checks the mass, in kilograms, of eight supply packs: 5, 7, 8, 9, 10, 11, 12, 50. Use the number line to help inspect the spread.

4.Place the eight pack masses on the number line. Which value is separated most from the rest?
05101520253035404550
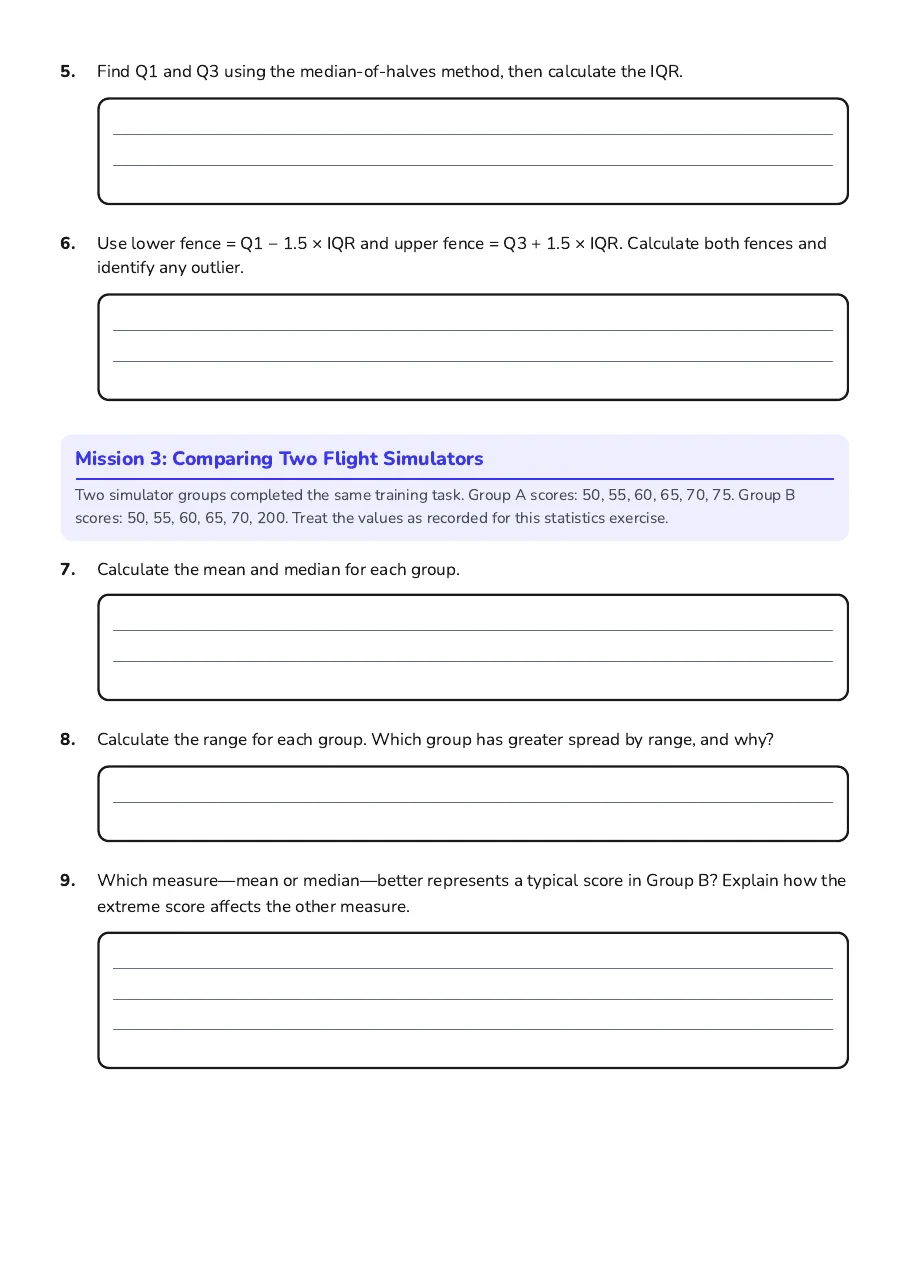
5.Find Q1 and Q3 using the median-of-halves method, then calculate the IQR.
6.Use lower fence = Q1 − 1.5 × IQR and upper fence = Q3 + 1.5 × IQR. Calculate both fences and identify any outlier.

Mission 3: Comparing Two Flight Simulators

Two simulator groups completed the same training task. Group A scores: 50, 55, 60, 65, 70, 75. Group B scores: 50, 55, 60, 65, 70, 200. Treat the values as recorded for this statistics exercise.

7.Calculate the mean and median for each group.
8.Calculate the range for each group. Which group has greater spread by range, and why?
9.Which measure—mean or median—better represents a typical score in Group B? Explain how the extreme score affects the other measure.
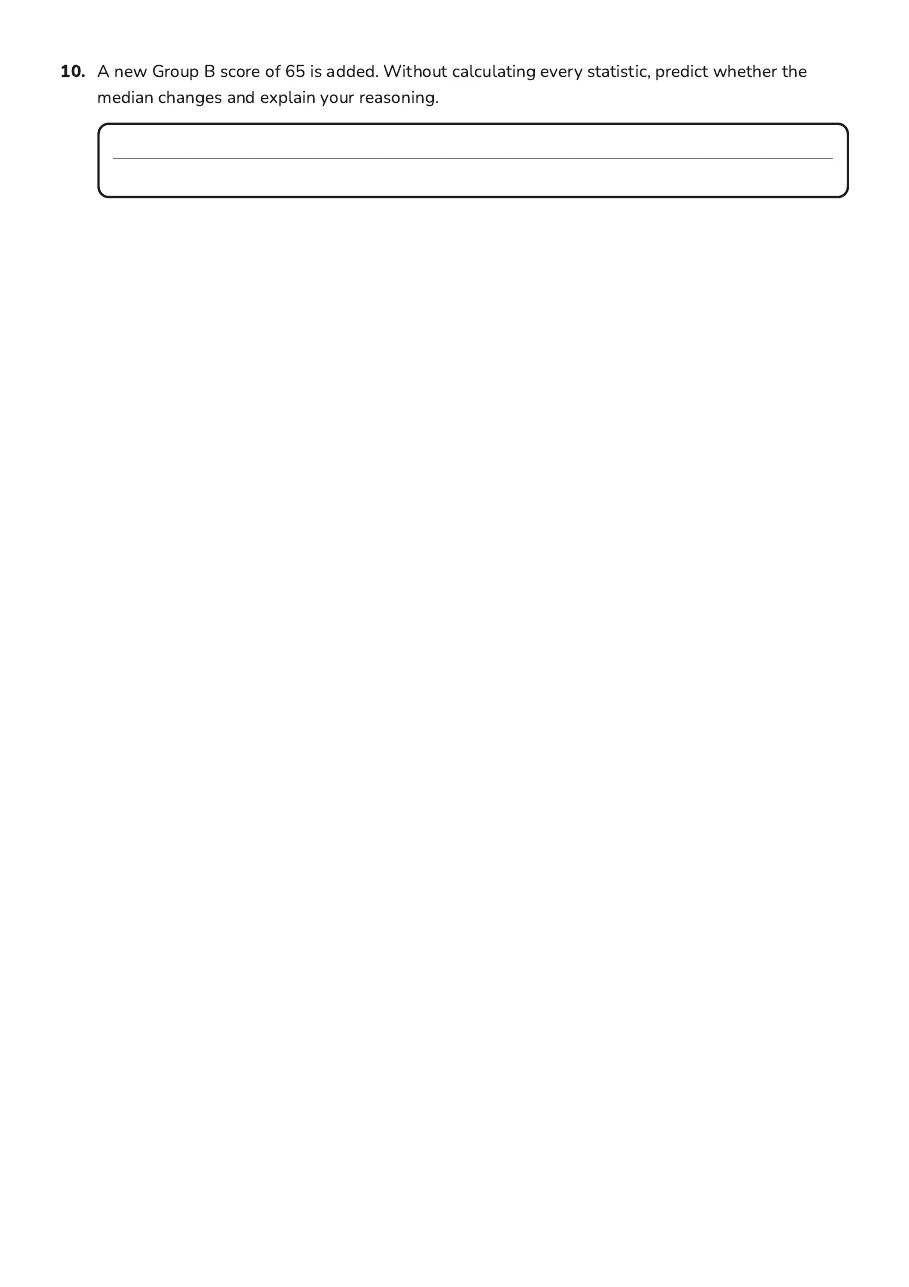
10.A new Group B score of 65 is added. Without calculating every statistic, predict whether the median changes and explain your reasoning.

3 printable pages

  • Data Analysis Worksheet, page 1 of 3: Mission 1: Crew Training Scores, Mission 2: Supply Pack Weights

    Page 1

  • Data Analysis Worksheet, page 2 of 3: Mission 3: Comparing Two Flight Simulators

    Page 2

  • Data Analysis Worksheet, page 3 of 3: 10. A new Group B score of 65 is added. Without calculating every statistic, predict…

    Page 3

About This Worksheet

Free in Kuraplan

Sign up free, grab the PDF, and customize it for your class.

Print-Ready

Formatted for standard paper. Clean layout, easy to read.

AI-Generated

Created with Kuraplan's AI, designed for real classroom use.

For Teachers & Parents

Use in classrooms, for homework, tutoring, or homeschool.

Need a custom version of this worksheet?

Kuraplan's AI generates custom worksheets in seconds — differentiated for every learner, aligned to your curriculum.

Generate Custom Worksheets — Free
No credit card Curriculum-aligned Under 60 seconds