MathsFreePrintable
Data Collection Model Evaluation
A free maths worksheet ready for your classroom. Open in Kuraplan to grab the print-ready PDF, customize it for your students, or generate a fresh version in seconds.
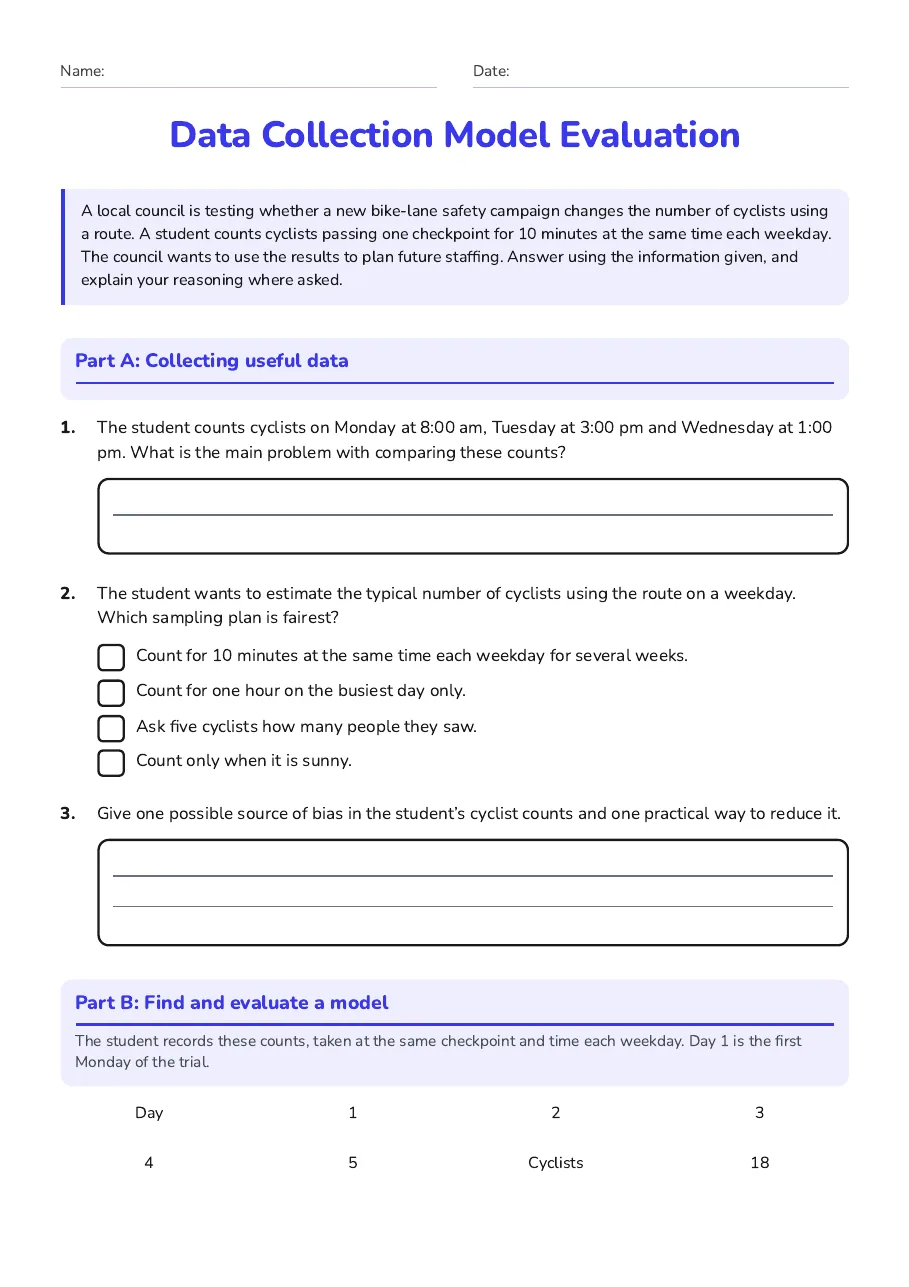
Name:Date:
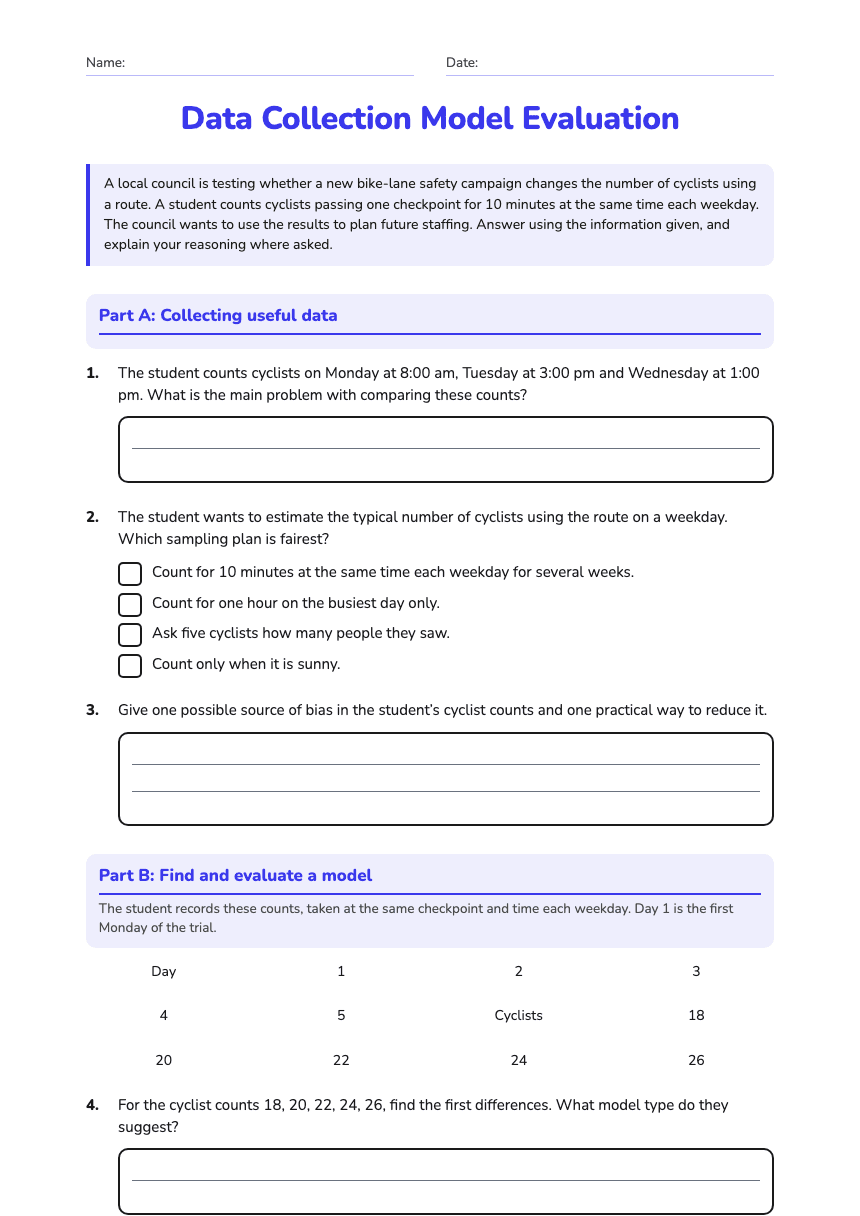
Data Collection Model Evaluation
A local council is testing whether a new bike-lane safety campaign changes the number of cyclists using a route. A student counts cyclists passing one checkpoint for 10 minutes at the same time each weekday. The council wants to use the results to plan future staffing. Answer using the information given, and explain your reasoning where asked.
Part A: Collecting useful data
1.The student counts cyclists on Monday at 8:00 am, Tuesday at 3:00 pm and Wednesday at 1:00 pm. What is the main problem with comparing these counts?
2.The student wants to estimate the typical number of cyclists using the route on a weekday. Which sampling plan is fairest?
- Count for 10 minutes at the same time each weekday for several weeks.
- Count for one hour on the busiest day only.
- Ask five cyclists how many people they saw.
- Count only when it is sunny.
3.Give one possible source of bias in the student’s cyclist counts and one practical way to reduce it.
Part B: Find and evaluate a model
The student records these counts, taken at the same checkpoint and time each weekday. Day 1 is the first Monday of the trial.
Day
1
2
3
4
5
Cyclists
18
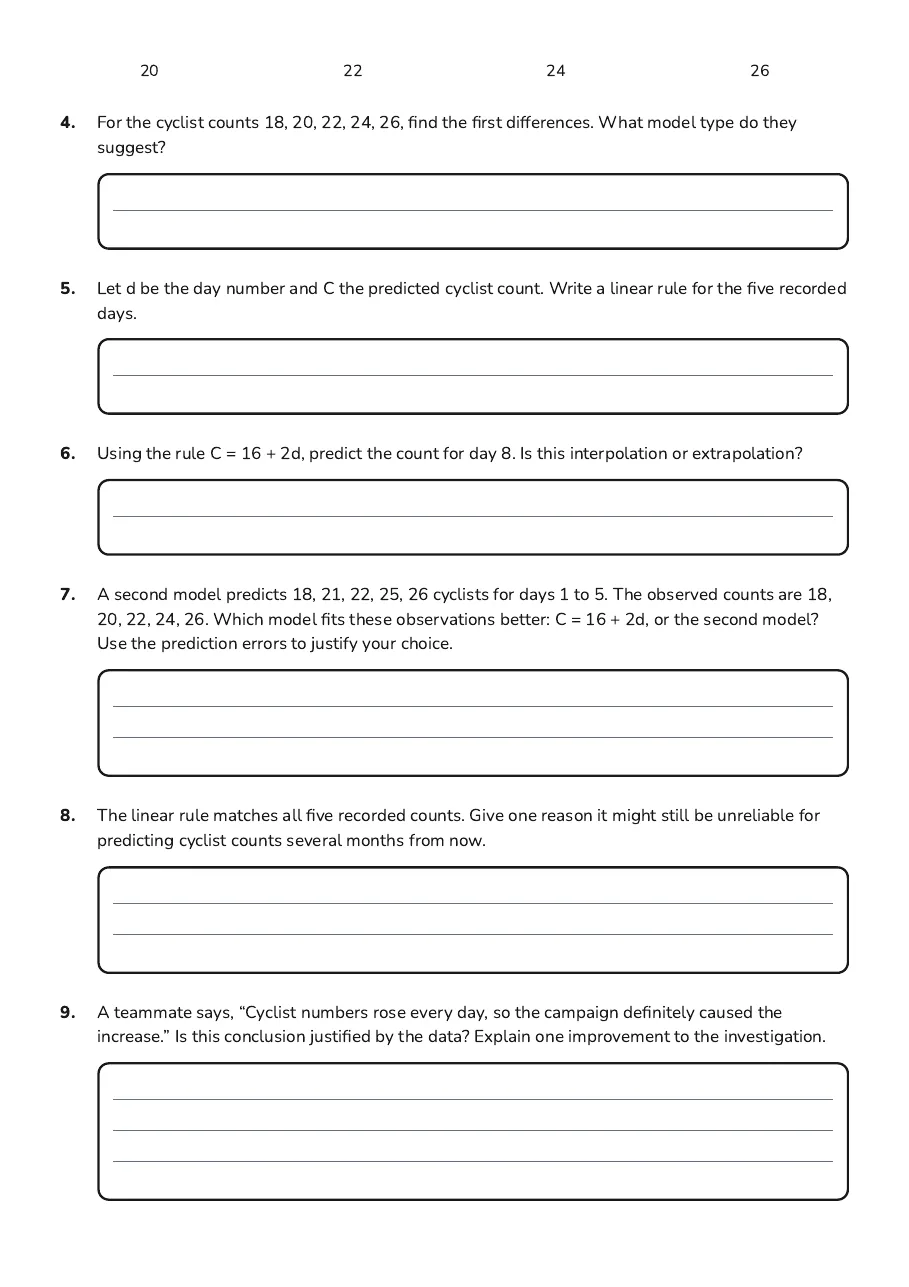
20
22
24
26
4.For the cyclist counts 18, 20, 22, 24, 26, find the first differences. What model type do they suggest?
5.Let d be the day number and C the predicted cyclist count. Write a linear rule for the five recorded days.
6.Using the rule C = 16 + 2d, predict the count for day 8. Is this interpolation or extrapolation?
7.A second model predicts 18, 21, 22, 25, 26 cyclists for days 1 to 5. The observed counts are 18, 20, 22, 24, 26. Which model fits these observations better: C = 16 + 2d, or the second model? Use the prediction errors to justify your choice.
8.The linear rule matches all five recorded counts. Give one reason it might still be unreliable for predicting cyclist counts several months from now.
9.A teammate says, “Cyclist numbers rose every day, so the campaign definitely caused the increase.” Is this conclusion justified by the data? Explain one improvement to the investigation.
2 printable pages
Page 1
Page 2
About This Worksheet
Free in Kuraplan
Sign up free, grab the PDF, and customize it for your class.
Print-Ready
Formatted for standard paper. Clean layout, easy to read.
AI-Generated
Created with Kuraplan's AI, designed for real classroom use.
For Teachers & Parents
Use in classrooms, for homework, tutoring, or homeschool.
Need a custom version of this worksheet?
Kuraplan's AI generates custom worksheets in seconds — differentiated for every learner, aligned to your curriculum.
Generate Custom Worksheets — Free No credit card Curriculum-aligned Under 60 seconds