MathsFreePrintable

Rivergum Market Probability Revision

A free maths worksheet ready for your classroom. Open in Kuraplan to grab the print-ready PDF, customize it for your students, or generate a fresh version in seconds.
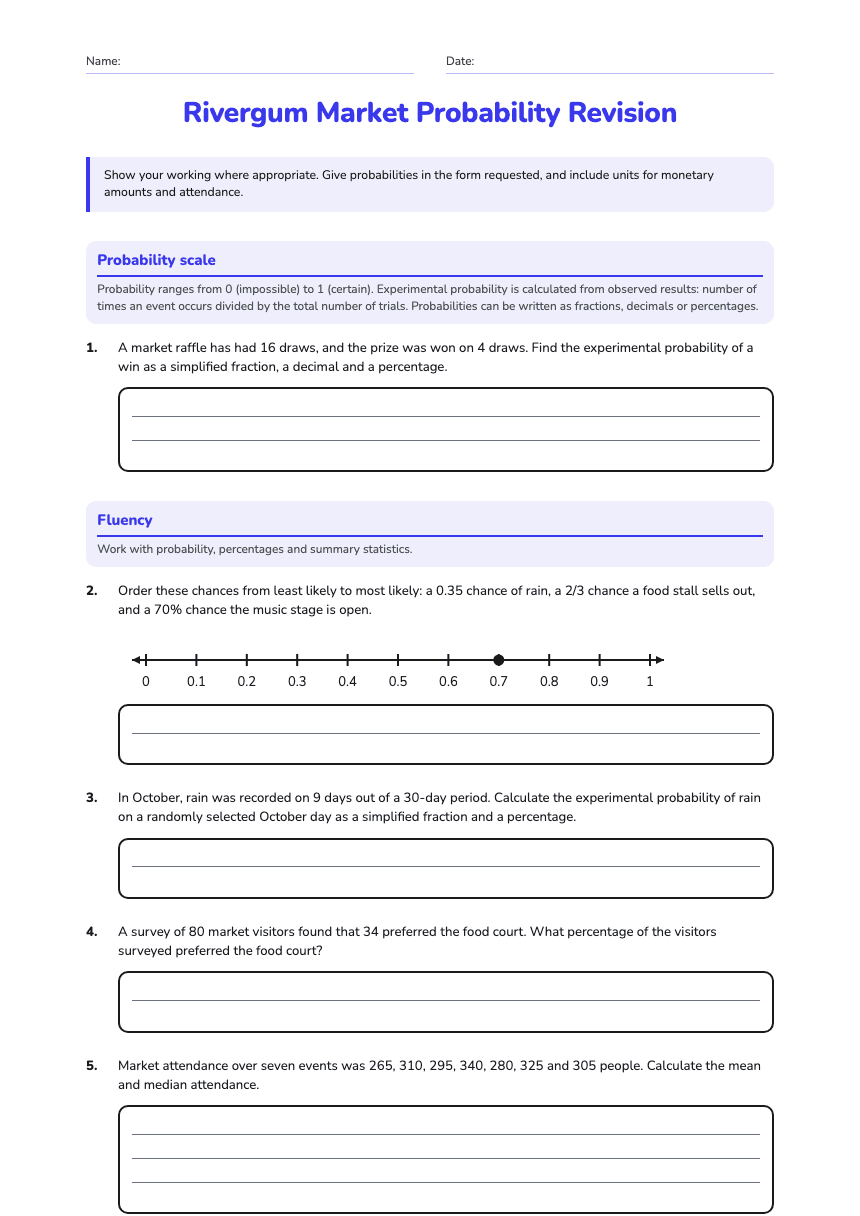
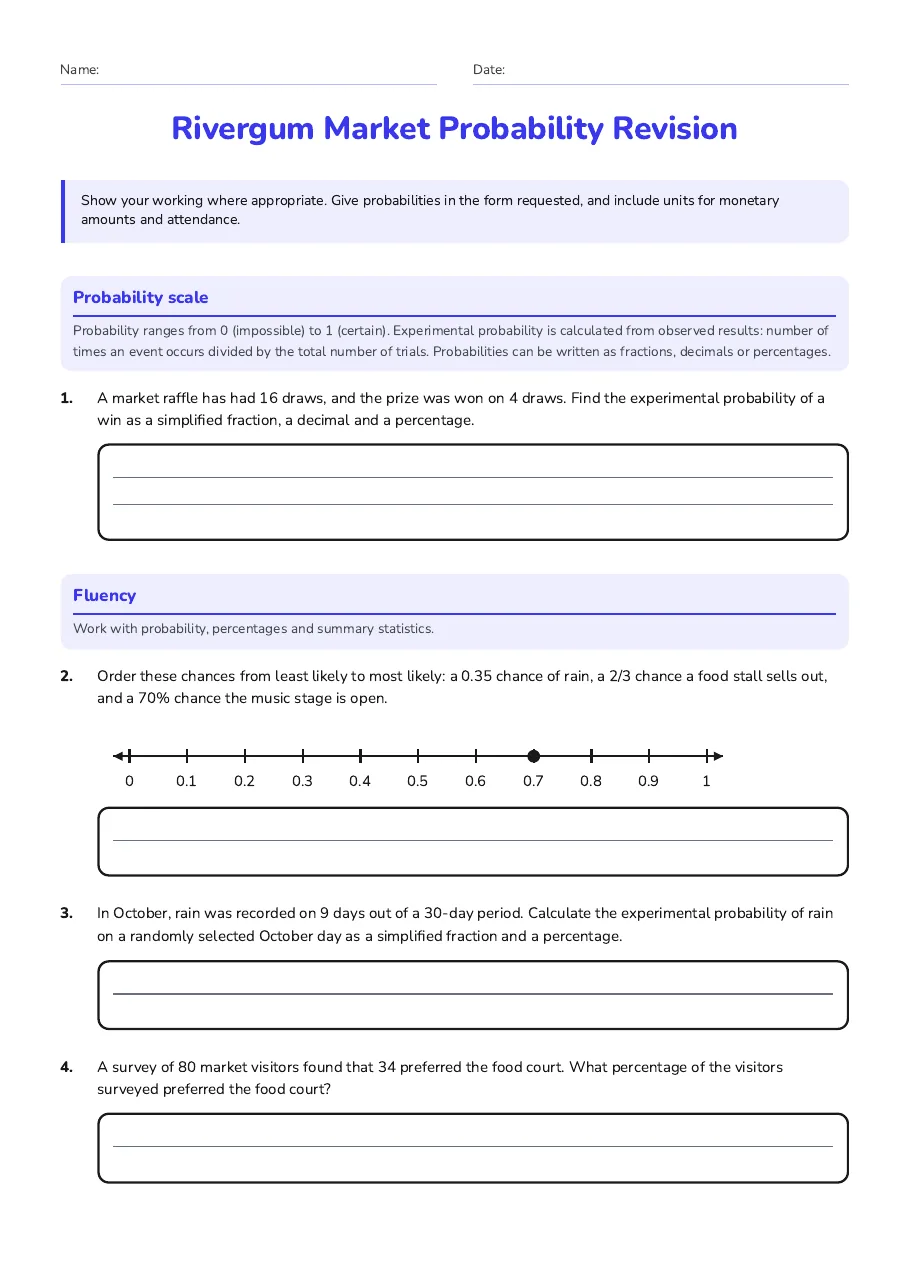
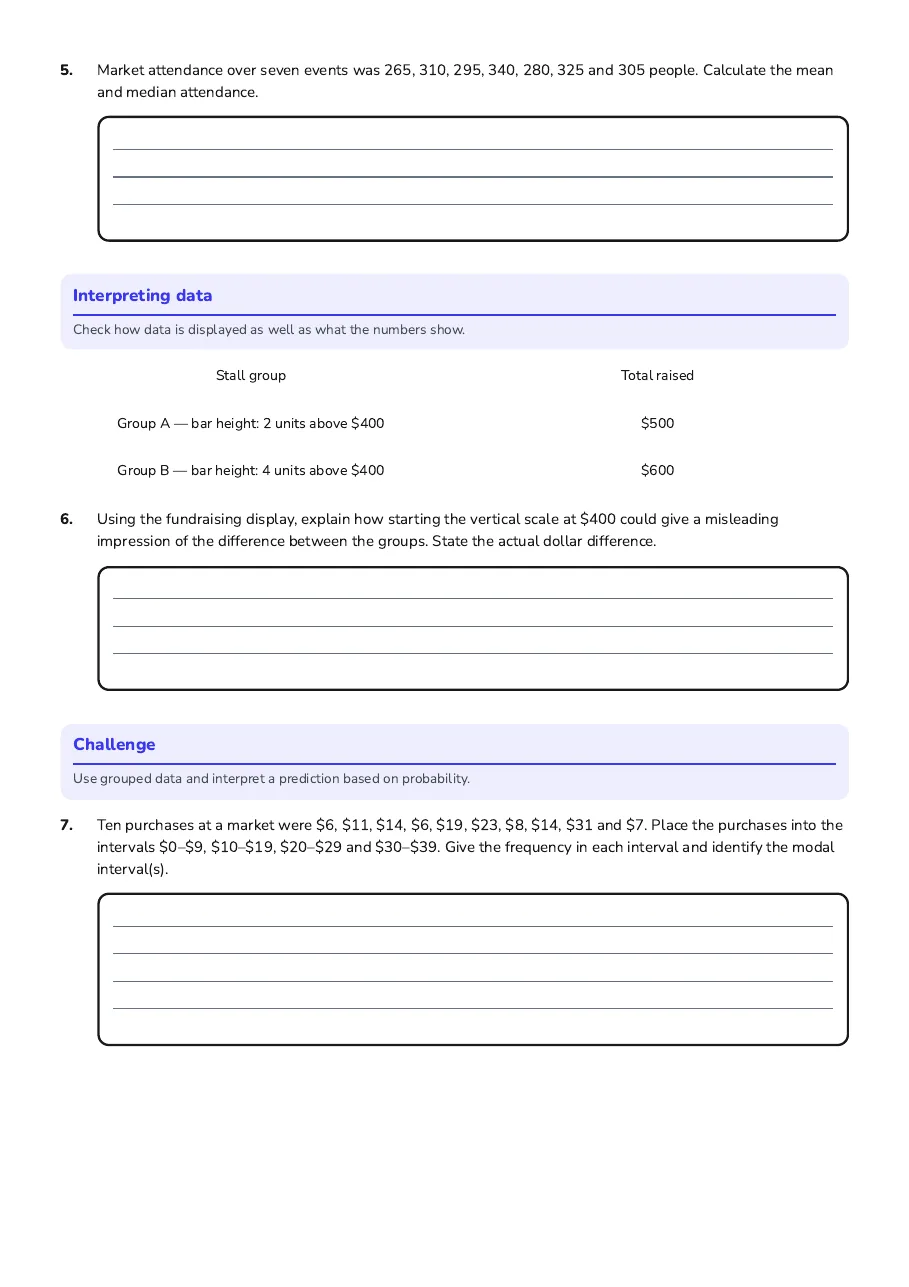
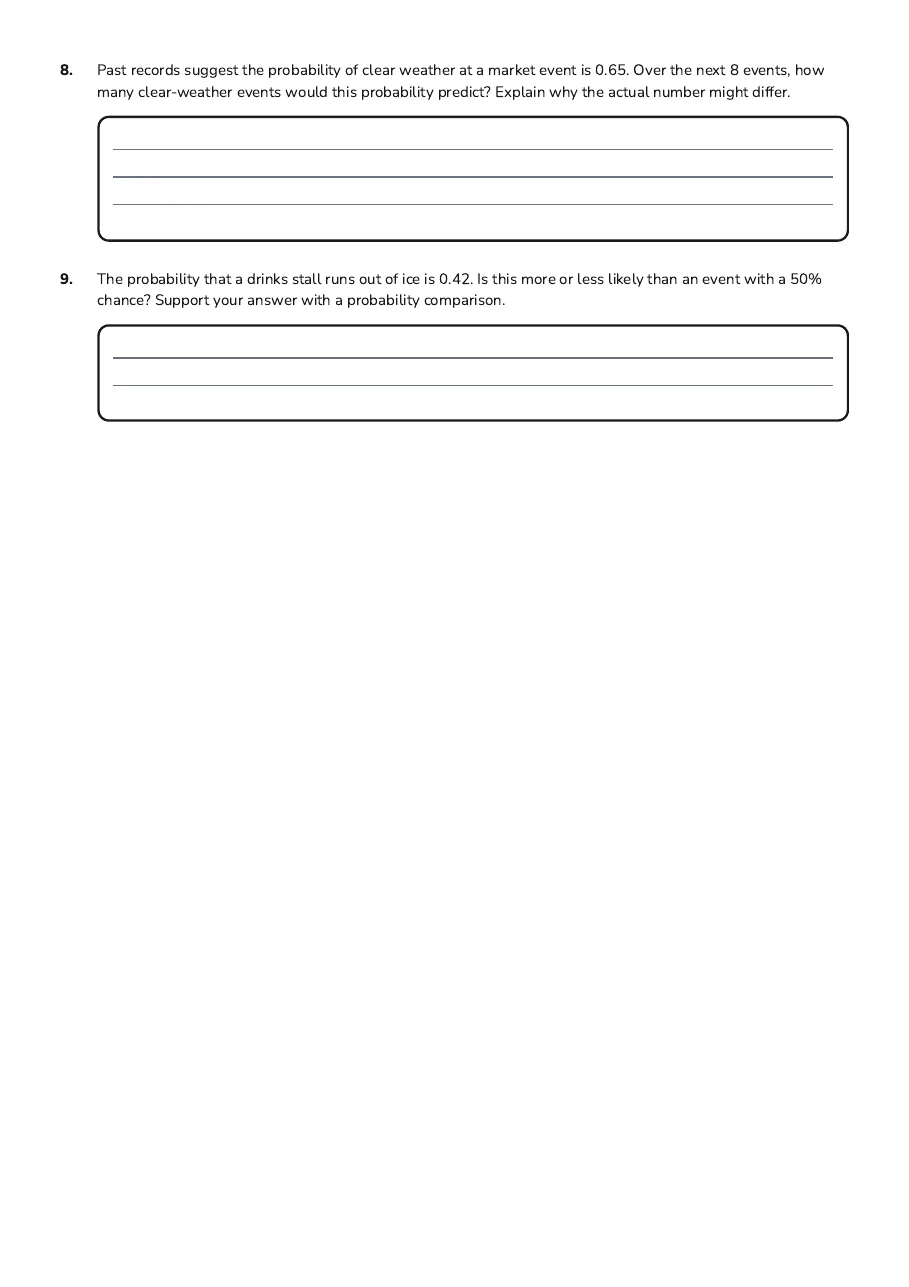
Rivergum Market Probability Revision worksheet preview

Rivergum Market Probability Revision

Rivergum Twilight Market scene with food trucks and stalls

🎯 Key Ideas

Probability Scale: Chance is measured from 0 (impossible) to 1 (certain). We can express probability as fractions, decimals, or percentages.

Experimental Probability: Based on past data. If it rained 3 out of 10 years, P(rain) = 3/10 = 0.3 = 30%

Averages: Mean (add all values ÷ number of values), Median (middle value when ordered), Mode (most frequent value)

Misleading Graphs: Truncated axes (not starting at 0) can exaggerate differences

📝 Worked Examples

Example 1: At Rivergum Twilight Market over 8 years, it rained on 2 occasions. What's the probability it will be fine this year?

Solution: Fine weather occurred 6 out of 8 years
P(fine) = 6/8 = 3/4 = 0.75 = 75%

Example 2: Students spent these amounts at the market: $8, $12, $8, $15, $20. Find the mean, median, and mode.

Solution:
Mean = (8 + 12 + 8 + 15 + 20) ÷ 5 = 63 ÷ 5 = $12.60
Ordered: $8, $8, $12, $15, $20 → Median = $12
Mode = $8 (appears twice)

✏️ Now You Try

The Rivergum Market lucky draw has been held 12 times. A student won 3 times. What's the probability a student wins? Express as a fraction, decimal, and percentage.

🔥 Fluency Questions

1. Place these probabilities in order from least likely to most likely:

P(rain in summer) = 0.2, P(food truck sells out) = 75%, P(live music plays) = 9/10

2. Monthly rainfall data for Rivergum shows: Jan (3 days), Apr (8 days), Jul (18 days), Oct (6 days). Each month has 30 days. Calculate the probability of rain on any given day in October.
3. Market stall survey results: Craft stalls (15 votes), Food trucks (25 votes), Music stage (8 votes), Lucky draw (12 votes). What percentage preferred food trucks?

🎯 Medium Questions

4. Attendance at past Rivergum Markets: 320, 280, 350, 290, 340, 300, 330. Calculate the mean and median attendance.
5. A graph shows Market A raised $400 and Market B raised $500, but the y-axis starts at $350. Explain why this could mislead people about the difference in fundraising.

🚀 Challenge Questions

6. Market spending data: $5, $8, $12, $5, $15, $25, $8, $5, $18, $30. Group this data into intervals ($0-$9, $10-$19, $20-$29, $30-$39) and identify which interval is the mode.
7. Based on 15 years of data, the probability of perfect weather for the market is 0.6. If the market runs for the next 5 years, predict how many years will have perfect weather. Is this prediction certain? Explain.

✅ Quick Checklist

I can convert between fractions, decimals, and percentages for probability

I can calculate experimental probability from data

I can find mean, median, and mode

I can identify when graphs might be misleading

I can order probabilities from least to most likely

🎫 Exit Ticket

At Rivergum Market, the probability of the coffee van running out is 0.4. Is this more or less likely than a 50% chance? Explain your reasoning using probability language.

📋 Worked Solutions

Now You Try: P(student wins) = 3/12 = 1/4 = 0.25 = 25%

Question 1: 0.2 (20%), 75%, 9/10 (90%). Order: 0.2, 75%, 9/10

Question 2: P(rain in Oct) = 6/30 = 1/5 = 0.2 = 20%

Question 3: Total votes = 15 + 25 + 8 + 12 = 60. Food trucks: 25/60 = 41.7%

Question 4: Mean = (320+280+350+290+340+300+330) ÷ 7 = 2210 ÷ 7 = 315.7. Ordered: 280, 290, 300, 320, 330, 340, 350. Median = 320

Question 5: Starting at $350 makes the $100 difference look much larger proportionally. The bars appear about 3 times different in height, but the actual difference is only 25%.

Question 6: $0-$9: $5,$8,$5,$8,$5 (5 values), $10-$19: $12,$15,$18 (3 values), $20-$29: $25 (1 value), $30-$39: $30 (1 value). Mode interval: $0-$9

Question 7: Prediction: 5 × 0.6 = 3 years with perfect weather. This is not certain - it's our best estimate based on past data, but actual results may vary.

Exit Ticket: 0.4 = 40%, which is less likely than 50%. The coffee van running out is unlikely (less than fifty-fifty chance).

About This Worksheet

Free in Kuraplan

Sign up free, grab the PDF, and customize it for your class.

Print-Ready

Formatted for standard paper. Clean layout, easy to read.

AI-Generated

Created with Kuraplan's AI, designed for real classroom use.

For Teachers & Parents

Use in classrooms, for homework, tutoring, or homeschool.

Need a custom version of this worksheet?

Kuraplan's AI generates custom worksheets in seconds — differentiated for every learner, aligned to your curriculum.

Generate Custom Worksheets — Free
No credit card Curriculum-aligned Under 60 seconds