MathsFreePrintable
Sports Statistics Analysis
A free maths worksheet ready for your classroom. Open in Kuraplan to grab the print-ready PDF, customize it for your students, or generate a fresh version in seconds.
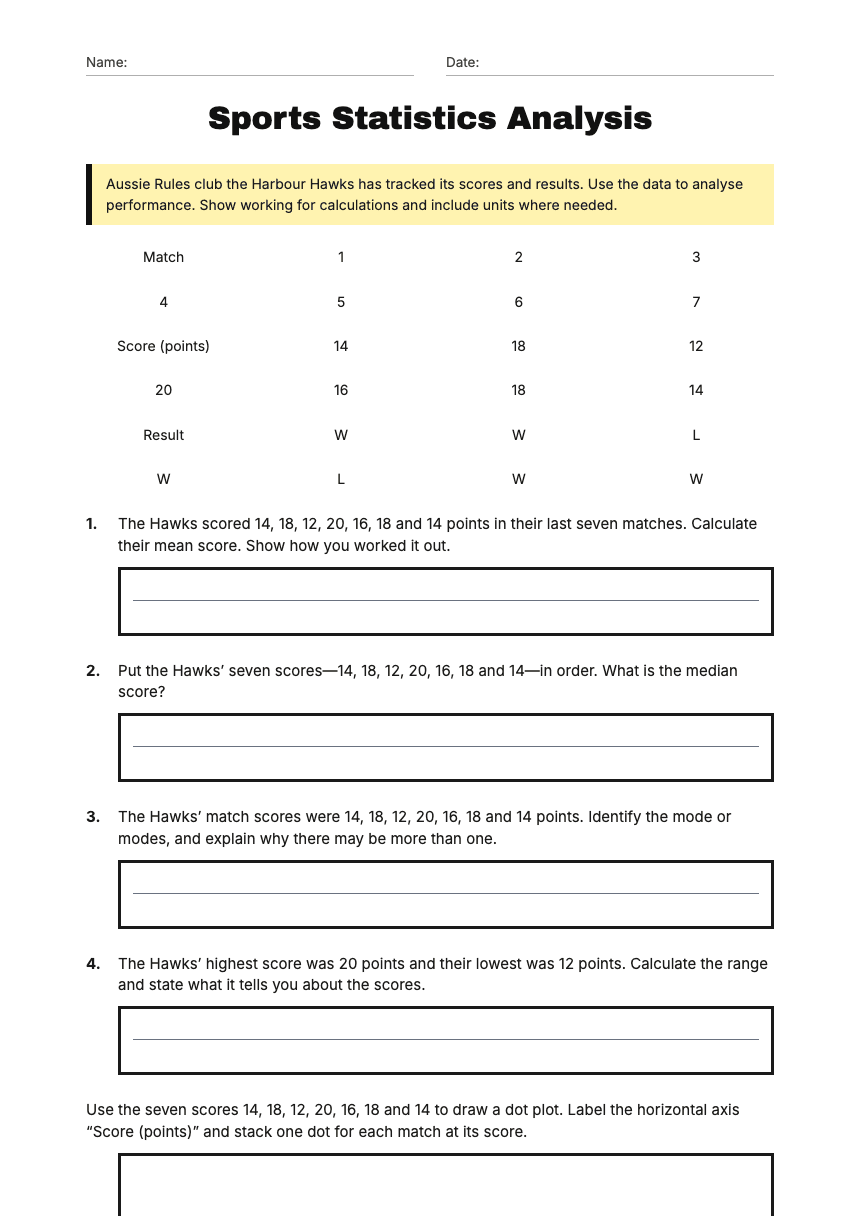
Name:Date:
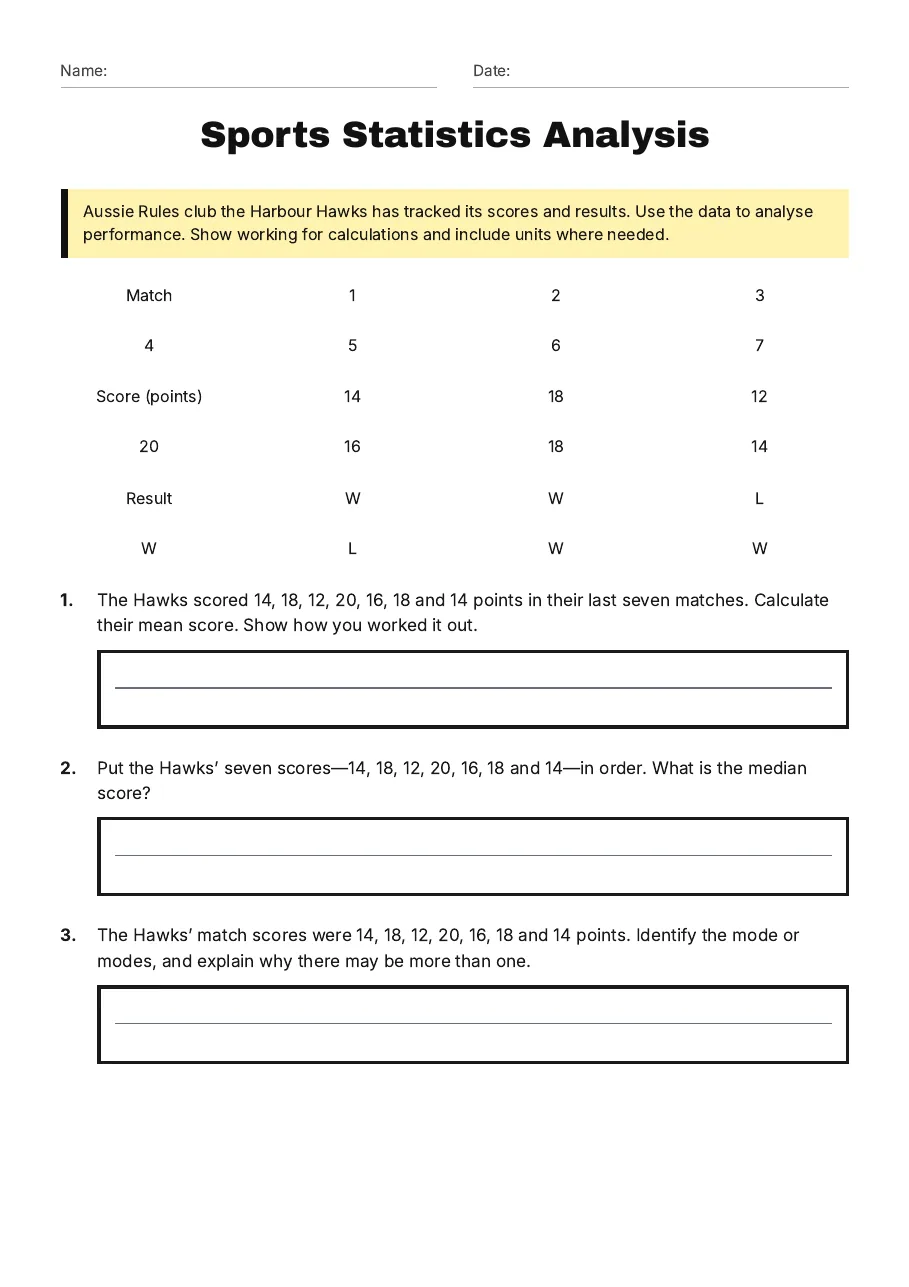
Sports Statistics Analysis
Aussie Rules club the Harbour Hawks has tracked its scores and results. Use the data to analyse performance. Show working for calculations and include units where needed.
Match
1
2
3
4
5
6
7
Score (points)
14
18
12
20
16
18
14
Result
W
W
L
W
L
W
W
1.The Hawks scored 14, 18, 12, 20, 16, 18 and 14 points in their last seven matches. Calculate their mean score. Show how you worked it out.
2.Put the Hawks’ seven scores—14, 18, 12, 20, 16, 18 and 14—in order. What is the median score?
3.The Hawks’ match scores were 14, 18, 12, 20, 16, 18 and 14 points. Identify the mode or modes, and explain why there may be more than one.
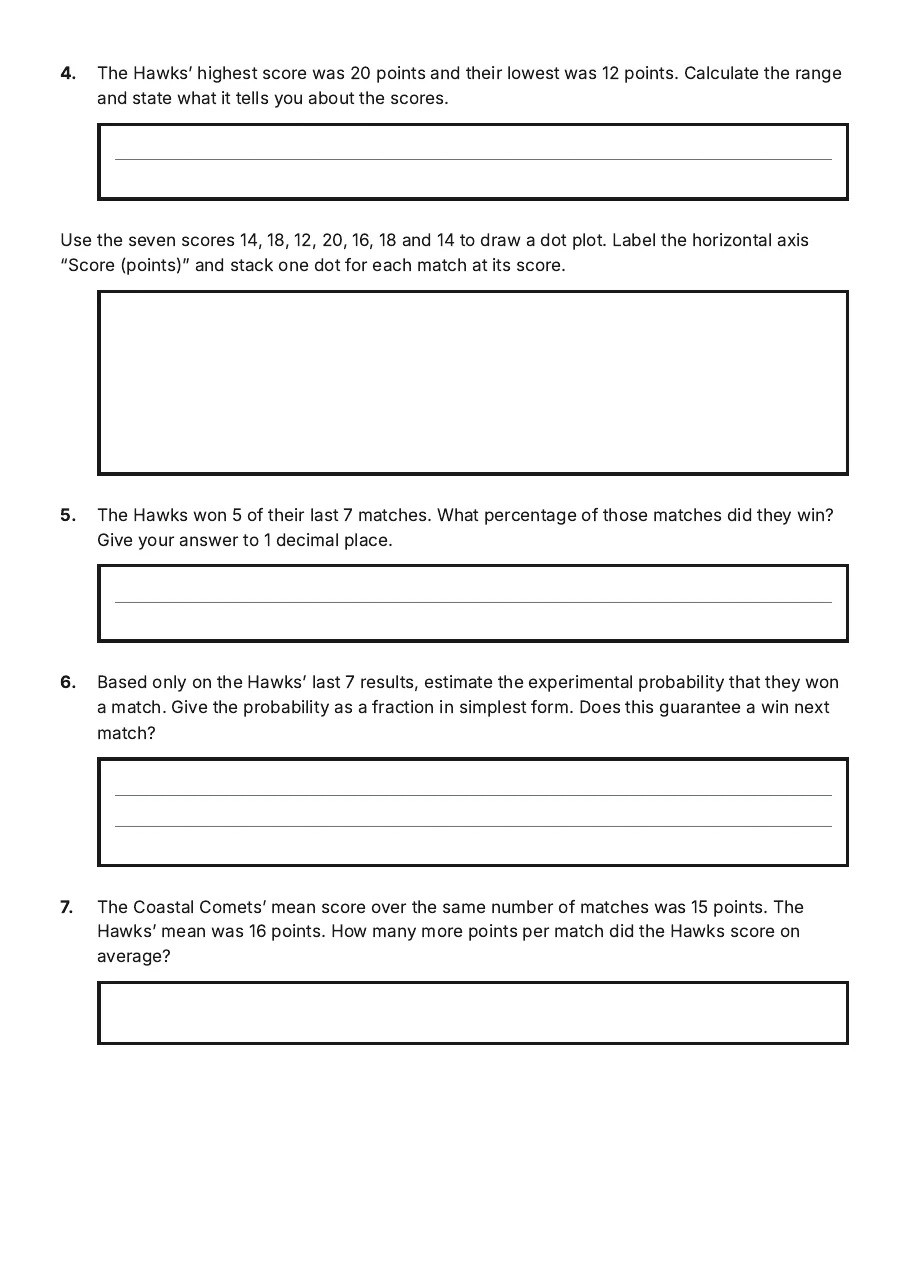
4.The Hawks’ highest score was 20 points and their lowest was 12 points. Calculate the range and state what it tells you about the scores.
Use the seven scores 14, 18, 12, 20, 16, 18 and 14 to draw a dot plot. Label the horizontal axis “Score (points)” and stack one dot for each match at its score.
5.The Hawks won 5 of their last 7 matches. What percentage of those matches did they win? Give your answer to 1 decimal place.
6.Based only on the Hawks’ last 7 results, estimate the experimental probability that they won a match. Give the probability as a fraction in simplest form. Does this guarantee a win next match?
7.The Coastal Comets’ mean score over the same number of matches was 15 points. The Hawks’ mean was 16 points. How many more points per match did the Hawks score on average?
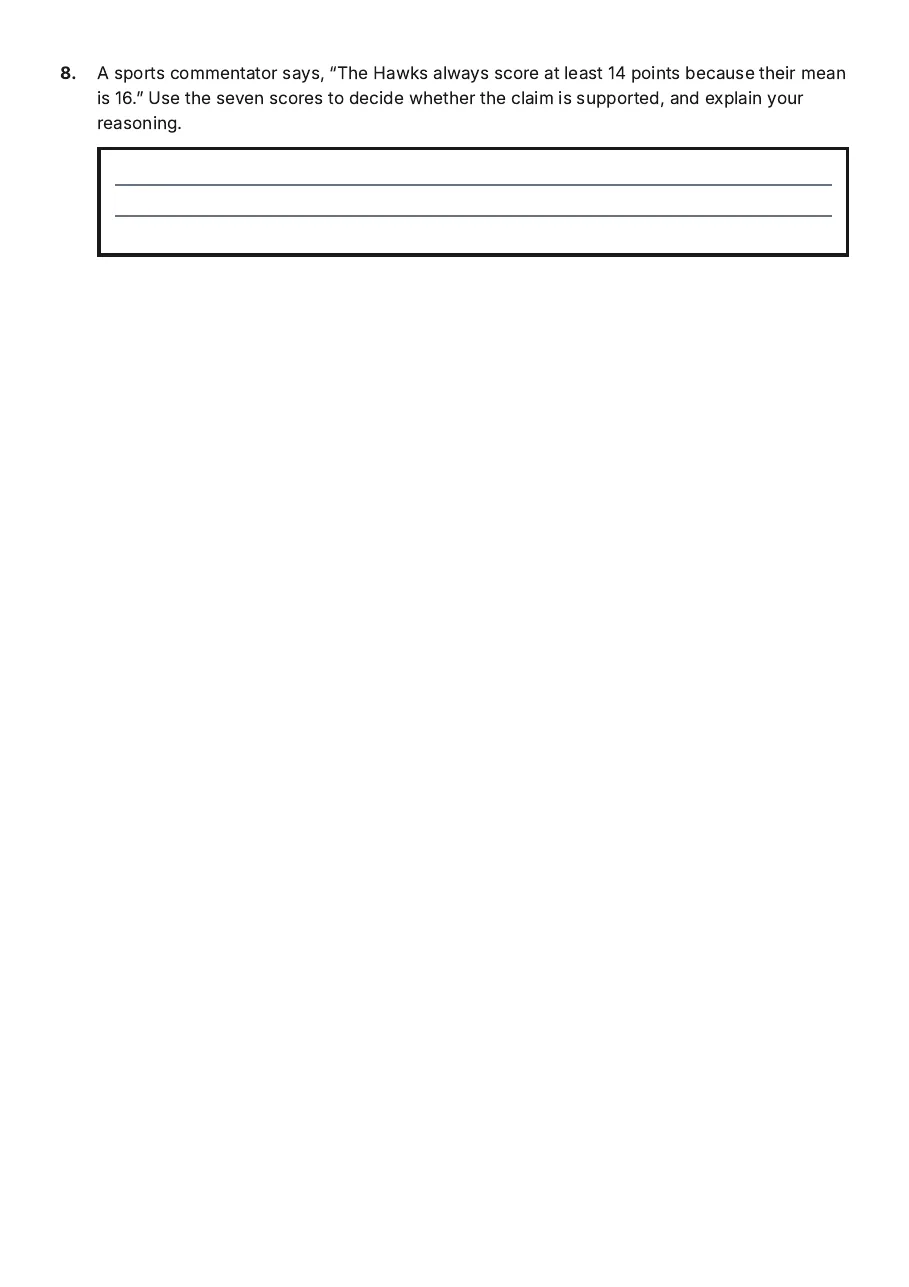
8.A sports commentator says, “The Hawks always score at least 14 points because their mean is 16.” Use the seven scores to decide whether the claim is supported, and explain your reasoning.
3 printable pages
Page 1
Page 2
Page 3
About This Worksheet
Free in Kuraplan
Sign up free, grab the PDF, and customize it for your class.
Print-Ready
Formatted for standard paper. Clean layout, easy to read.
AI-Generated
Created with Kuraplan's AI, designed for real classroom use.
For Teachers & Parents
Use in classrooms, for homework, tutoring, or homeschool.
Need a custom version of this worksheet?
Kuraplan's AI generates custom worksheets in seconds — differentiated for every learner, aligned to your curriculum.
Generate Custom Worksheets — Free No credit card Curriculum-aligned Under 60 seconds