Temperature Line Graph Worksheet
A free maths worksheet ready for your classroom. Open in Kuraplan to grab the print-ready PDF, customize it for your students, or generate a fresh version in seconds.
Temperature Line Graph Worksheet

📊 Part 1: Creating Your Line Graph
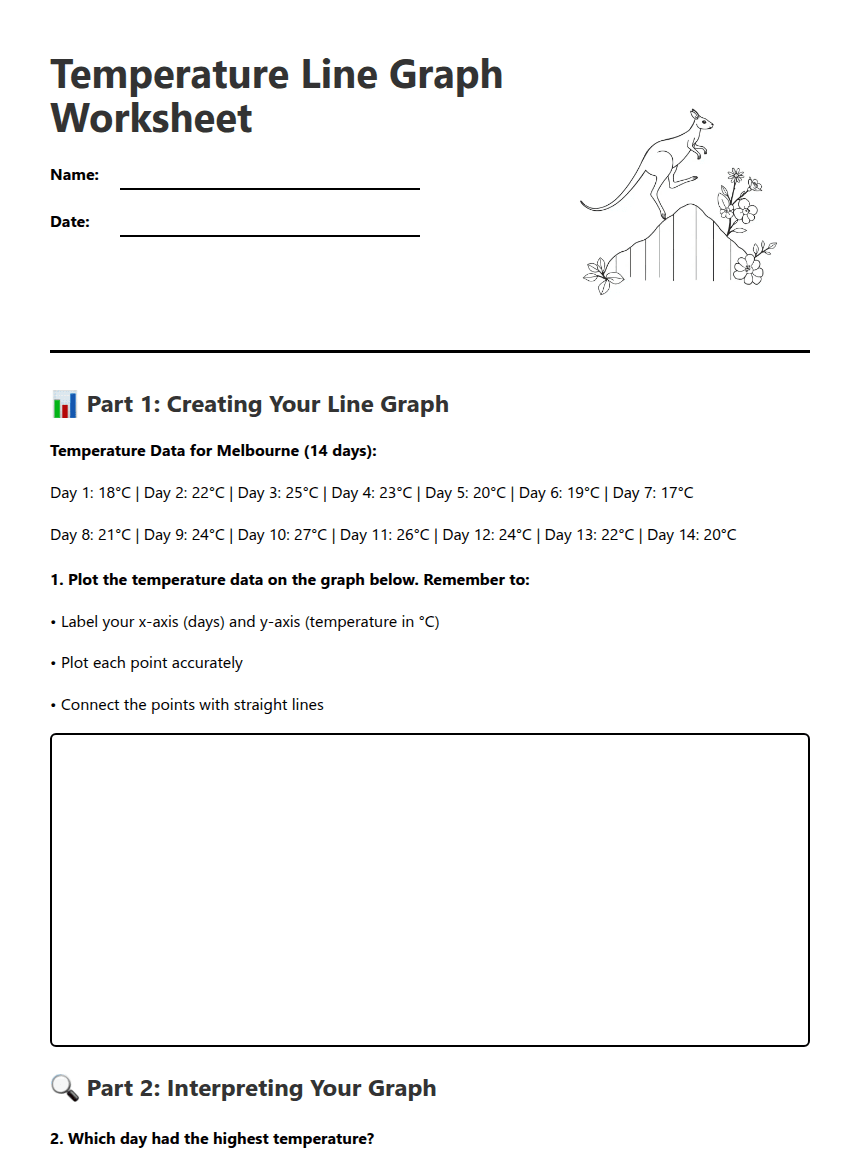
Temperature Data for Melbourne (14 days):
Day 1: 18°C | Day 2: 22°C | Day 3: 25°C | Day 4: 23°C | Day 5: 20°C | Day 6: 19°C | Day 7: 17°C
Day 8: 21°C | Day 9: 24°C | Day 10: 27°C | Day 11: 26°C | Day 12: 24°C | Day 13: 22°C | Day 14: 20°C
• Label your x-axis (days) and y-axis (temperature in °C)
• Plot each point accurately
• Connect the points with straight lines
🔍 Part 2: Interpreting Your Graph
💭 Part 3: Data Analysis
About This Worksheet
Free in Kuraplan
Sign up free, grab the PDF, and customize it for your class.
Print-Ready
Formatted for standard paper. Clean layout, easy to read.
AI-Generated
Created with Kuraplan's AI, designed for real classroom use.
For Teachers & Parents
Use in classrooms, for homework, tutoring, or homeschool.
Need a custom version of this worksheet?
Kuraplan's AI generates custom worksheets in seconds — differentiated for every learner, aligned to your curriculum.
Generate Custom Worksheets — FreeMore Maths Worksheets

Year 7 Statistics Pretest
Free
Year 7 Statistics and Probability Pretest
Free
Rivergum Market Probability Revision
Free
Z-Scores in Real Life
Free
Stem-and-Leaf Plots Worksheet
Free
Carnival Game Probability Challenge
Free
Drawing Histograms Worksheet
Free