Picture a fourth-grade class staring at a photograph of a flooded street. One student calls out that it's sad. Nobody is wrong, but nobody has looked yet. The water line on the shop window, the traffic cone drifting past a parking meter, the man carrying a child on his shoulders: those details are what turn a reaction into an argument.
That gap between reacting and reading is where visual literacy activities earn their place in the timetable. Every routine below aims at one moment, the moment a student stops describing a picture and starts reasoning about it. Each entry covers what students practice, how to run it, the grade bands where it fits, a classroom example, and the point where you have to step back and let them work. That step-back is the part teachers skip, and it's the part that makes the routine work. If you do the looking for them, they never learn to look.
1. See-Think-Wonder
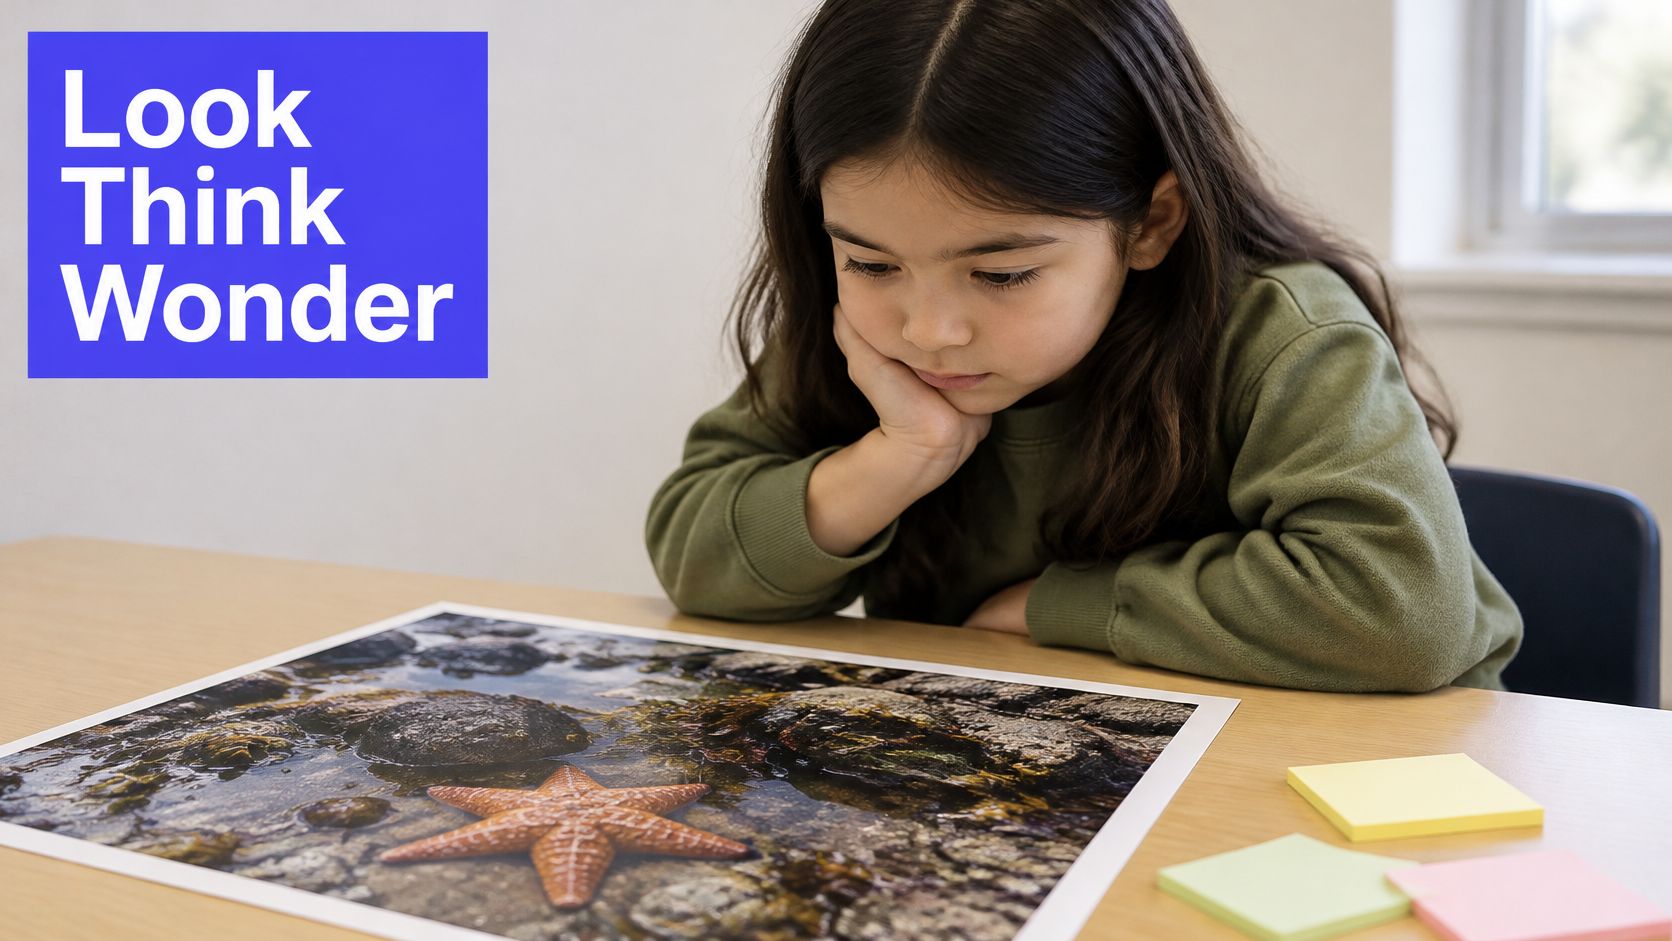
Students answer three questions in order: what do you see, what do you think about it, what does it make you wonder. The order is the whole trick. Observation sits in one column and interpretation in another, so a student has to produce evidence before making a claim.
The Victorian Department of Education's visual literacy guidance describes the same movement as literal, inferential and evaluative thinking: locate and recall what's visible, combine it with prior knowledge to explain meaning, then apply or critique the idea. It asks teachers to get students explaining their reasons and using visual-design metalanguage, which in plain terms means naming what the image does. Words like framing, scale and contrast give a student something to point at.
Running it in twenty minutes
Hand out a three-column sheet or three sticky notes. Project one image. Hold the class in the seeing column longer than feels comfortable, because the first thirty seconds produce the obvious details and the useful ones arrive after that.
Grade band notes: in K-2, run it aloud and record responses on chart paper. Grades 3-5 write in columns and share in pairs. Grade 6 and up must cite a visible detail for every claim in the thinking column.
First grade, tide pool: a photo of a tide pool typically draws a noticing about a crab shell, then a guess that the crab is hiding, then a wondering about what it does when the tide comes back. Photograph the chart and use the wondering column as your question board for the week.
Middle school history: a Dorothea Lange photograph gives you a wonder column that turns into research questions about the Dust Bowl. That beats a question list you wrote yourself.
Where you step back: once you've modeled the difference between seeing and thinking with one deliberately confusing image, your job is to record and ask "where do you see that?" Don't confirm the thinking column. Test those claims against a text next lesson.
How you know it worked: count how many think statements point to something visible. That count is your progress measure. A column full of unsupported claims means you rushed the timer.
What to prepare: one image with enough detail for five minutes of looking. When you need a fresh one fast, Kuraplan generates kid-friendly illustrations and diagrams you can drop in as the starting image.
2. Visual Thinking Strategies (VTS)
Three questions, asked again and again about a single image: what's going on in this picture, what do you see that makes you say that, and what more can we find. The teacher paraphrases each response and points back to the image. That pointing is what keeps the group on the evidence instead of drifting into opinion.
The results are the best documented of any routine here. A three-year VTS study with 181 students in three treatment schools and 56 in one control school found that treatment-group students doubled their observations and interpretations after the first year, with oral critical-thinking gains by Grade 3 and written gains by Grade 4 that held into Grade 5, as summarized in a Western Connecticut State University study poster. The same study reported Florida Achievement Test increases of approximately 0.35 to 0.40 points where visual literacy growth tracked with reading and math scores. The control school showed no such relationship.
The paraphrase is the method
Paraphrasing isn't a courtesy. It's how you signal what counts as an answer. When a kindergartner says "the man is mad," you reply, "You're noticing his face and his fists, and that makes you think he's angry." You've just modeled evidence and inference in one sentence, without a single correction.
Grade band notes: K-2 can run VTS on one image for ten minutes with no writing at all. Grades 3-6 can handle a second image for comparison in the same session. Secondary classes need the third question pushed hardest, and they can take over the paraphrase role, which is where the discussion gets usefully uncomfortable.
Science application: microscope images and cell diagrams work well because the ambiguity is real. Students argue about whether a dark spot is a nucleus, and the argument is the lesson.
Keep a running list of the words students use. Build the vocabulary lesson from their language instead of handing them the glossary.
Where you step back: you supply no information about the image during the discussion. Not the artist, not the date, not the answer. Save the facts for the end, once the group has committed to a reading and can defend it.
How you know it worked: record two minutes of discussion before and after a term of VTS and count observations and evidence-based interpretations. Observation counts that rise while interpretation counts stay flat mean students are listing, not reasoning.
3. Gallery Walk
Post images, student work or questions around the room. Small groups rotate and leave notes, sticky comments or a shared question at each station. Run badly, it's a display with clipboards. Run well, students meet five interpretations of the same material and have to decide which one the evidence supports.
The three-year Artful Citizenship Project report is the closest thing to a benchmark for this kind of work. Students in participating schools showed higher growth in visual literacy than students in a comparison school, and growth in visual literacy correlated with three of four academic achievement measures at coefficients between 0.35 and 0.40. The report is careful not to claim that visual instruction alone caused the gains. It does suggest that interpreting images, discussing artistic choices and making visual work belongs inside ordinary subject teaching.
Station design that forces reasoning
Four to six stations is the practical limit for a forty-minute lesson. Give each group a different colored marker so you can trace who wrote what at the debrief. Assign recorder, questioner and reporter so nobody spectates.
Grade band notes: K-1 need three stations and an adult at each. Grades 2-5 manage five stations in fifteen minutes if the prompt at each station is a single sentence. Secondary groups need a comparison task, such as deciding which of the displayed maps is most misleading and why.
Geography example: post six maps of the same region from different eras. Each station asks for one thing that changed and one thing that stayed. The debrief question is which change mattered most and how they'd defend that.
Math example: post four graphs with truncated axes or missing scales. Groups annotate what each graph would lead a viewer to believe.
Where you step back: don't correct a station note while the group is standing there. Circulate, listen and note the two or three misconceptions you'll raise in the debrief.
How you know it worked: the debrief tells you. If groups only read out what they wrote, the rotation was clerical. If they argue with a previous group's note, it worked.
If you want the rotation structure built for you, this inference gallery walk worksheet sets up the station prompts and the note-taking frame.
4. Picture Walk
Before reading an illustrated book, page through the pictures and talk about what's there. Students predict, notice details and build background knowledge before they decode a single word, which is exactly the order struggling readers need.
Teachers already lean on visuals far more than they realize. In an elementary classroom study, teachers estimated that visual materials made up about 25% of the classroom materials they used, more than verbal, textual, tangible or interactive materials, and they named engagement, making abstract ideas concrete and reinforcement through a second modality as the main benefits (Microsoft Research classroom study). That's a lot of weight resting on pictures often chosen for decoration.
Running the walk
Cover the text with sticky notes under a document camera, or hold the book up. Ask two questions per spread: what's happening here, and what tells you that. Pause before the final page and predict the ending from visual clues only.
Grade band notes: pre-K and K need an adult leading, one spread at a time. Grades 1-2 can run it in pairs with a challenge to find one detail on each spread that doesn't match the text. Grades 3-5 use it with graphic novels and nonfiction, where diagrams carry content the words leave out.
Special education: a picture walk before a graphic novel introduces characters and setting before anyone has to decode dialogue, which lowers the load at the exact point students usually stall.
Teacher preparation programs treat this as core training rather than a soft skill. A 2024 visual-literacy intervention study in the Journal of Visual Literacy worked with 224 first-year early-childhood and primary-education students in Madrid (Taylor & Francis study).
Where you step back: stop confirming predictions. "Will it happen?" is a trap. Ask "what in the picture makes you think so?" and move to the next spread.
How you know it worked: watch independent reading. Does the student return to the picture when they hit an unknown word? That's the transfer you're after.
For more engaging first-grade reading ideas to pair with this routine, keep a short list of before-reading prompts by the reading table. If your book doesn't cover the topic at all, Kuraplan can generate kid-friendly illustrations for the preview.
5. Primary Source Photo Analysis
A historical photograph can show who and what is in the frame, but students also need to ask who made it and why. Use a sequence of questions: What do you observe? What can you infer? What do you still need to know? The Library of Congress Analyzing Photographs and Prints worksheet directs students to notice people, objects, setting, and clues about date and purpose. The goal is to treat an image as a source created for a purpose, not as a complete account.
This approach has a long history in education. A systematic review in the Journal of Visual Literacy traces visual literacy research to work on audiovisual instruction, curriculum programs, and later efforts to consolidate the field. It examined empirical studies across countries and found that implementation and assessment remain fragmented. A long research history does not guarantee a consistent classroom routine.
The step most teachers skip
Cover the caption before students begin. Ask them to infer the date, place, and purpose from the image, then reveal the caption and invite them to revise. Pair the photograph with a short written source so students can compare what the image suggests with what the text supports.
Grade band notes: Grade 5 students can analyze an early-1900s factory photograph alongside a second source. High school students can examine World War I propaganda posters and identify what each poster asks its audience to do. A Journal of Visual Literacy study examined visual-literacy instructional strategies developed by secondary English-language-arts and social-studies pre-service teachers.
Ask, “What's missing from this picture?” Students may notice whose perspective is shown, who is absent, and what the frame leaves out.
Where you step back: Let students make and revise their own dating guesses. Giving them the answer removes the reasoning that makes the exercise useful.
The limit of looking
Visual expertise alone cannot establish whether an image is authentic. In a study of 104 participants evaluating 50 real and AI-generated images, overall identification accuracy was 63.7%, and accuracy for images produced with FLUX.1-dev was 29%. Age was associated with lower detection odds. Education, gender, prior AI-tool use, media work, and editing experience showed no significant effects, according to a 2025 study indexed in PubMed.
Build the lesson around provenance rather than a simple “real or fake” verdict. Ask where the image came from, who published it first, what evidence could confirm it, and how much confidence the available evidence supports. Students should leave knowing that a plausible-looking image still needs checking.
How you know it worked: A student can explain what the photograph supports, what it cannot establish, and one check to make before relying on it.
A visual text analysis worksheet brings observation, inference, and source-checking prompts together for secondary classes.
6. Visual Storyboarding and Sequencing
Students arrange images in order to show a process, a story or a cause-and-effect chain, then explain the sequence in words. Sequencing forces a decision: which moments matter most, and how one image connects to the next.
Set the panel count
Fix the number of panels at four or six. A blank page and the instruction "make a storyboard" produces decoration. Four boxes produce selection, because something has to be cut.
Grade band notes: grade 2 sequences a butterfly life cycle and writes a caption for each stage. Grade 5 storyboards a historical event. Middle and high school storyboard a science process with arrows showing how each stage feeds the next.
Science example: photosynthesis in six panels, with the arrow from the light reactions into the Calvin cycle labeled by the student rather than by you.
Standards give you a progression to hang this on. The National Core Arts Standards handbook sets out learning progressions from pre-kindergarten through grade 12, organized around 15 enduring understandings with corresponding performance standards for each grade band, and runs them through creating, presenting or producing, responding, and connecting. That lets you revisit the same task with rising complexity: describe visual choices in the early grades, analyze how they communicate meaning in middle school, then critique and create visual messages in high school.
Where you step back: students swap storyboards with a partner and check whether the sequence makes sense without explanation. You collect the ones that don't and show them anonymously.
When the images are generated
Audit generated visuals before students use them. A 2025 content analysis of 291 AI-generated images depicting STEM occupations found gender bias in 21.3%, racial bias in 18.9%, eye disfigurement in 17.9% and hand inaccuracies in 22.3% (TechTrends content analysis). The same source reports AI images increased emotional engagement by 22% in a literature-learning context while interpretive diversity fell from nine thematic variants to three. More engaging is not the same as more thinking.
That's a strong activity in itself. Hand out the generated image, ask students to audit representation, scientific errors and effects on interpretation, then rewrite the image brief and regenerate. Kuraplan's image generation can produce the sequence diagrams for the ordering task so you aren't hunting for photosynthesis panels at eleven at night.
How you know it worked: the student can explain why panel three comes before panel four without reading their own caption aloud.
7. Sketchnoting and Visual Note-Taking
Students take notes with words, simple drawings, arrows, icons and organizers instead of full sentences. The constraint does the teaching. You can't sketchnote a lecture verbatim, so you have to decide what matters and how ideas connect.
Model it live
Draw your notes on the board while you teach and narrate the choices. "I'm putting the three causes in a column because they're parallel, and this arrow goes back because the third one loops into the first." Give a symbol bank of arrows, stars, lightbulbs and question marks so nobody stalls on art.
Grade band notes: grades 3-5 start with a template that already has boxes and arrows. Middle school can handle a blank page plus a symbol bank. High school biology sketchnotes the immune system; a history class builds a visual timeline of a revolution with small drawings at key events.
Stick figures are fine. Say that out loud, or half the class will spend the period trying to draw a horse.
The engagement trap
Here's the trade-off nobody puts on the slide deck. Students enjoy these tasks, and enjoyment is easy to mistake for learning. A 2024 study in Libri found that 90.5% of respondents liked using films, games and drawings to learn new concepts, and 89.3% found the learning activities enjoyable (Libri study). That tells you the format will be popular. It tells you nothing about whether the notes captured the right relationships.
Judge the notes by the arrows, not by the drawings. A beautiful page with no connections drawn has failed the task.
Where you step back: don't grade the art. Grade whether the page shows relationships, sequence and the two or three big ideas you named.
How you know it worked: a week later, ask a student to explain one arrow from memory. If the sketchnote worked, they can.
If you want a second structure to teach alongside it, organizing notes with mind maps covers the branching layout that suits cause-and-effect topics better than a linear page.
8. Infographic and Chart Analysis
Students read a chart and explain what it shows, what it leaves out, and how the design steers the conclusion. Then they rebuild it so the honest reading is the easy one.
Amount matters, not just presence. A multimedia-learning experiment found significantly better outcomes when learners encountered three visual multimedia elements than when they encountered none or only one (Cognitive Research experiment). Three coordinated visuals, say a labeled diagram, a process sequence and a comparison image, with a task asking students to explain how they relate, beat a slide packed with decoration. The same caution applies to accessibility: check labels, contrast and reading order before you hand it out, especially for multilingual learners.
Start with your own bad chart
Build the first example yourself so students watch the design choices being made. Same data, two scales. Then move to published infographics once they know what to look for.
Grade band notes: grades 2-4 read pictographs and work out what one symbol stands for. Grades 5-8 compare two versions of the same bar chart, one truncated and one full. High school civics critiques a voter turnout infographic and rewrites it with context.
Ask students to write a one-sentence headline the chart supports, then compare it with the headline that ran.
Where you step back: let a wrong reading stand for a minute. Ask "what would a viewer who only saw this chart believe?" before you explain the axis.
How you know it worked: the student names the missing context and says what would fix the chart.
Kuraplan's educational infographic generator creates custom diagrams and charts, so you can build three or four examples at the right level of complexity instead of borrowing whatever you find online.
How the six visual literacy activities compare
| Item | Best grade band | Time needed | Prep effort | Core visual skill |
|---|---|---|---|---|
| See-Think-Wonder | All grades | 10–15 minutes | Almost none | Separate observation from interpretation |
| Visual Thinking Strategies (VTS) | All grades | 10–20 minutes | Choose a detailed image; practice facilitation | Support interpretations with visual evidence |
| Gallery Walk | All grades | 30–45 minutes | Moderate; prepare and post stations | Compare and interpret visuals |
| Picture Walk | Emergent and early readers | A few minutes | Minimal | Use illustrations to predict and build meaning |
| Primary Source Photo Analysis | Upper elementary to high school | 20–30 minutes | Moderate; select and contextualize sources | Analyze visual evidence, purpose, and perspective |
| Visual Storyboarding and Sequencing | Elementary to high school | 20–40 minutes | Low to moderate; prepare images or panels | Sequence visuals to show order and cause and effect |
| Sketchnoting and Visual Note-Taking | Upper elementary to high school | 20–30 minutes | Low; model layouts and symbols | Represent ideas and relationships visually |
| Infographic and Chart Analysis | Middle school to high school | 20–40 minutes | Moderate; choose suitable examples | Interpret data and evaluate visual design |
Use the time ranges to choose a routine that fits the lesson, then watch for the point when students move from describing details to explaining what those details mean. A younger student might use a picture walk to predict what happens next; an older student might compare a primary-source photograph with its context. In each case, prompt students to point to evidence, then give them room to build and revise their own interpretations.
Pick One Routine and Try It Before Friday
You don't need all eight of these running by next week. Choose one that fits the unit you're already teaching, run it once with a clear image and a fixed number of minutes, and write down where students got stuck. Most teachers find that See-Think-Wonder or a Picture Walk is the easiest start, because the structure is visible to the class and needs no materials beyond one image.
A second routine comes naturally once the first has built the habit of looking before concluding. Pair a gallery walk with the chart analysis routine and you've got a full week of visual work without adding a new unit.
Some honest trade-offs to plan around:
- Gallery walks collapse into busywork without a comparison question, so write the debrief prompt before you write the station prompts.
- Sketchnotes look impressive and teach little unless you check for drawn relationships, not neatness.
- No amount of looking makes students reliable detectors of synthetic images, so plan for provenance checks instead of confidence.
- Three relevant visuals outperform ten decorative ones, and that's a design rule, not a style preference.
When you need fresh images, diagrams or sequence visuals for any of these routines, Kuraplan generates kid-friendly visuals and custom diagrams. It also takes a finished lesson and turns it into a printable or shareable worksheet with one click, complete with images and age-appropriate question types, so the activity is ready before the bell.
Start with the routine closest to what you're teaching tomorrow. One image, three questions, ten minutes, and a class that stops saying "it's sad" and starts saying why.
Visual literacy activities live or die on the images you put in front of students, and Kuraplan generates the diagrams, illustrations and kid-friendly visuals that make each routine runnable at short notice. Any lesson you build can become a printable worksheet with images and age-appropriate questions in one click, so a See-Think-Wonder chart or a chart-analysis task is ready for the next morning. Head to Kuraplan to build your first image set and see how it fits the routines above.