MathsFreePrintable

Christmas Data Presentations

A free maths worksheet ready for your classroom. Open in Kuraplan to grab the print-ready PDF, customize it for your students, or generate a fresh version in seconds.
Christmas Data Presentations worksheet preview
Name:Date:

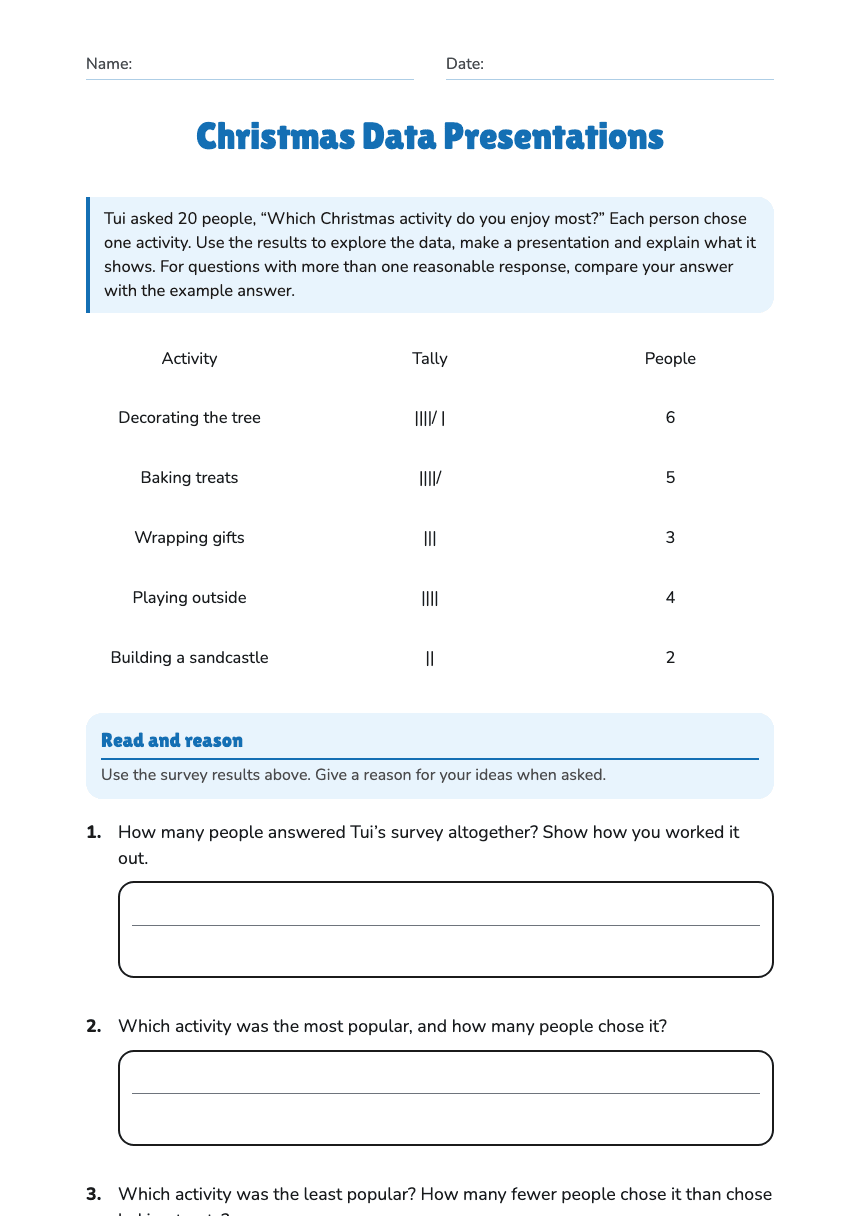
Christmas Data Presentations

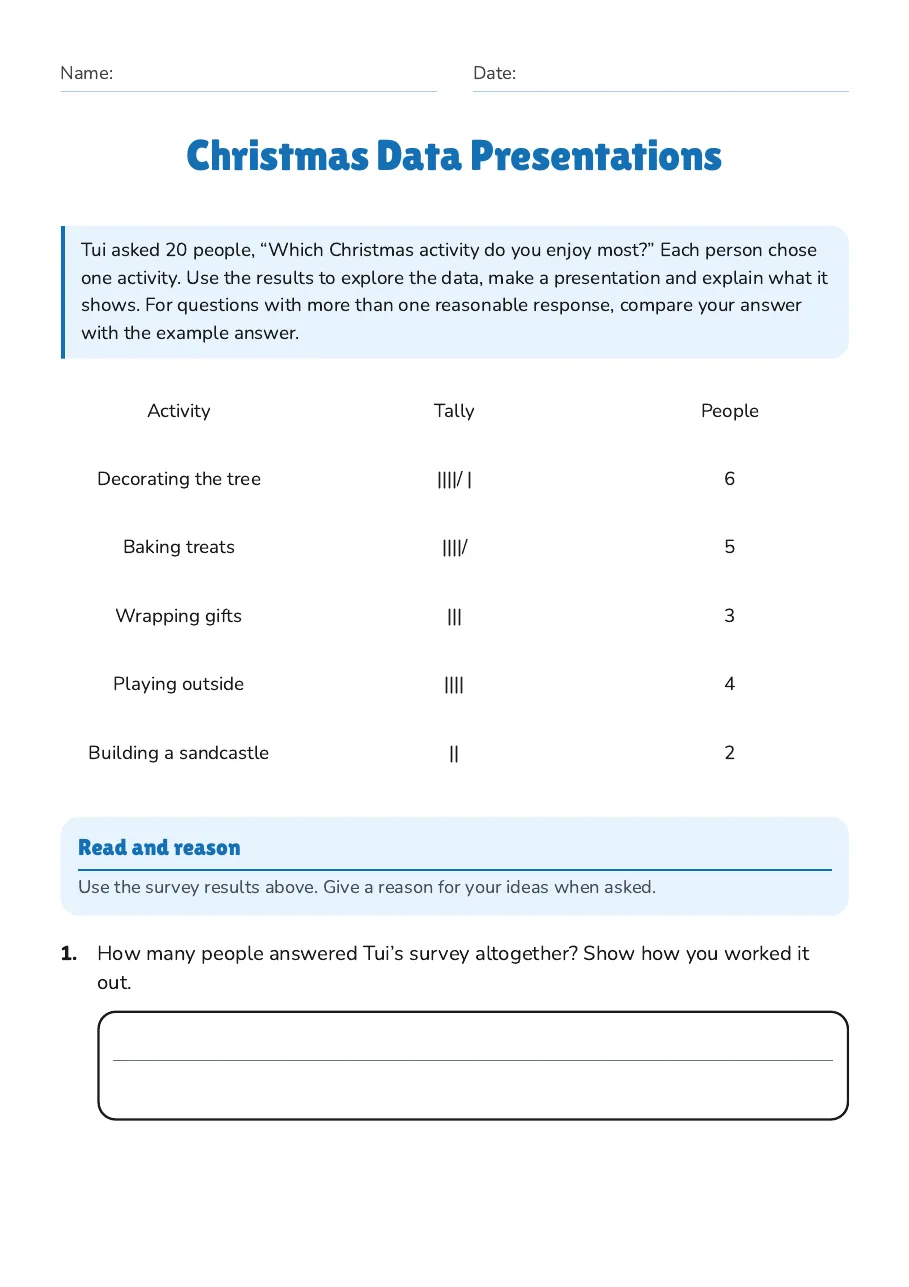
Tui asked 20 people, “Which Christmas activity do you enjoy most?” Each person chose one activity. Use the results to explore the data, make a presentation and explain what it shows. For questions with more than one reasonable response, compare your answer with the example answer.

Activity

Tally

People

Decorating the tree

||||/ |

6

Baking treats

||||/

5

Wrapping gifts

|||

3

Playing outside

||||

4

Building a sandcastle

||

2

Read and reason

Use the survey results above. Give a reason for your ideas when asked.

1.How many people answered Tui’s survey altogether? Show how you worked it out.
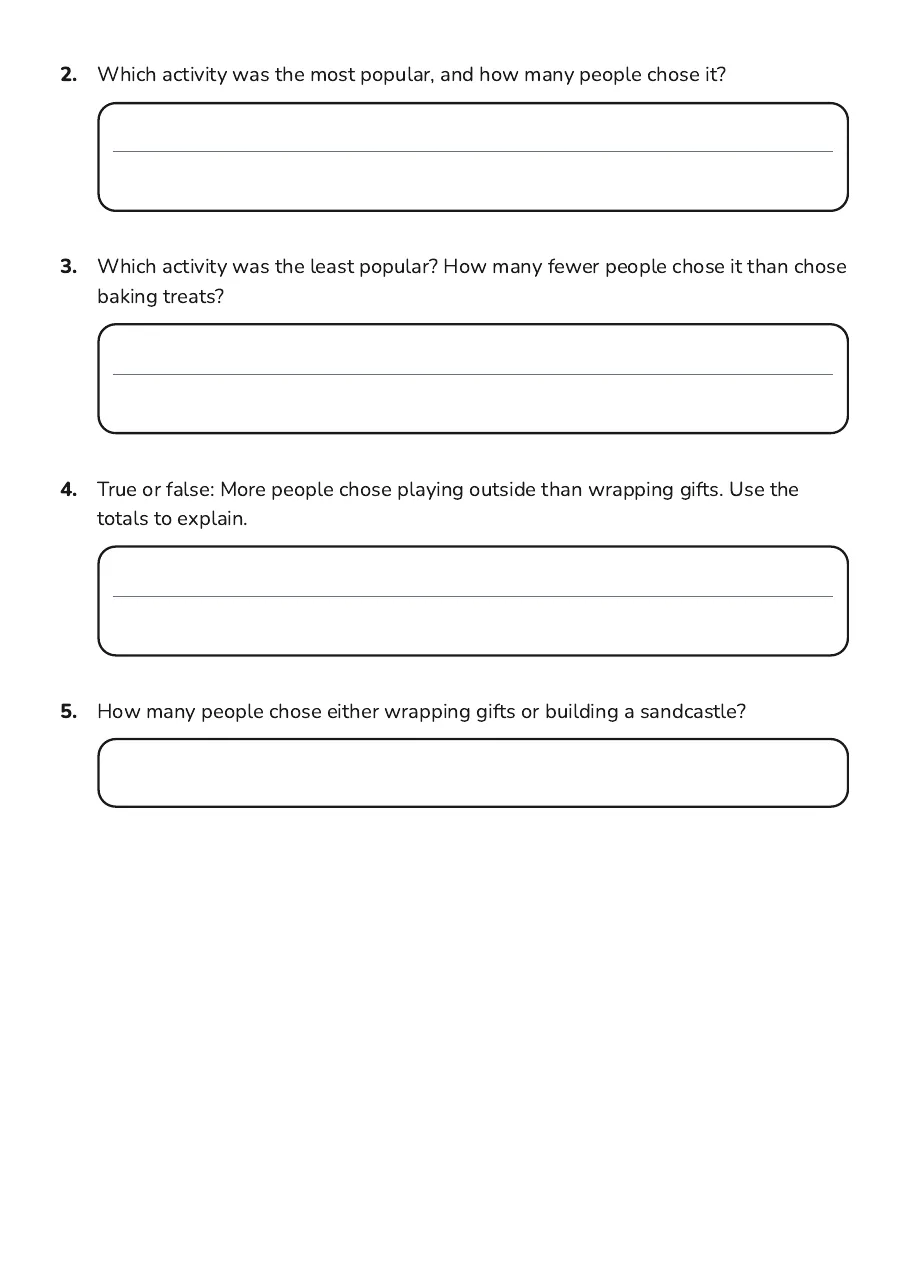
2.Which activity was the most popular, and how many people chose it?
3.Which activity was the least popular? How many fewer people chose it than chose baking treats?
4.True or false: More people chose playing outside than wrapping gifts. Use the totals to explain.
5.How many people chose either wrapping gifts or building a sandcastle?

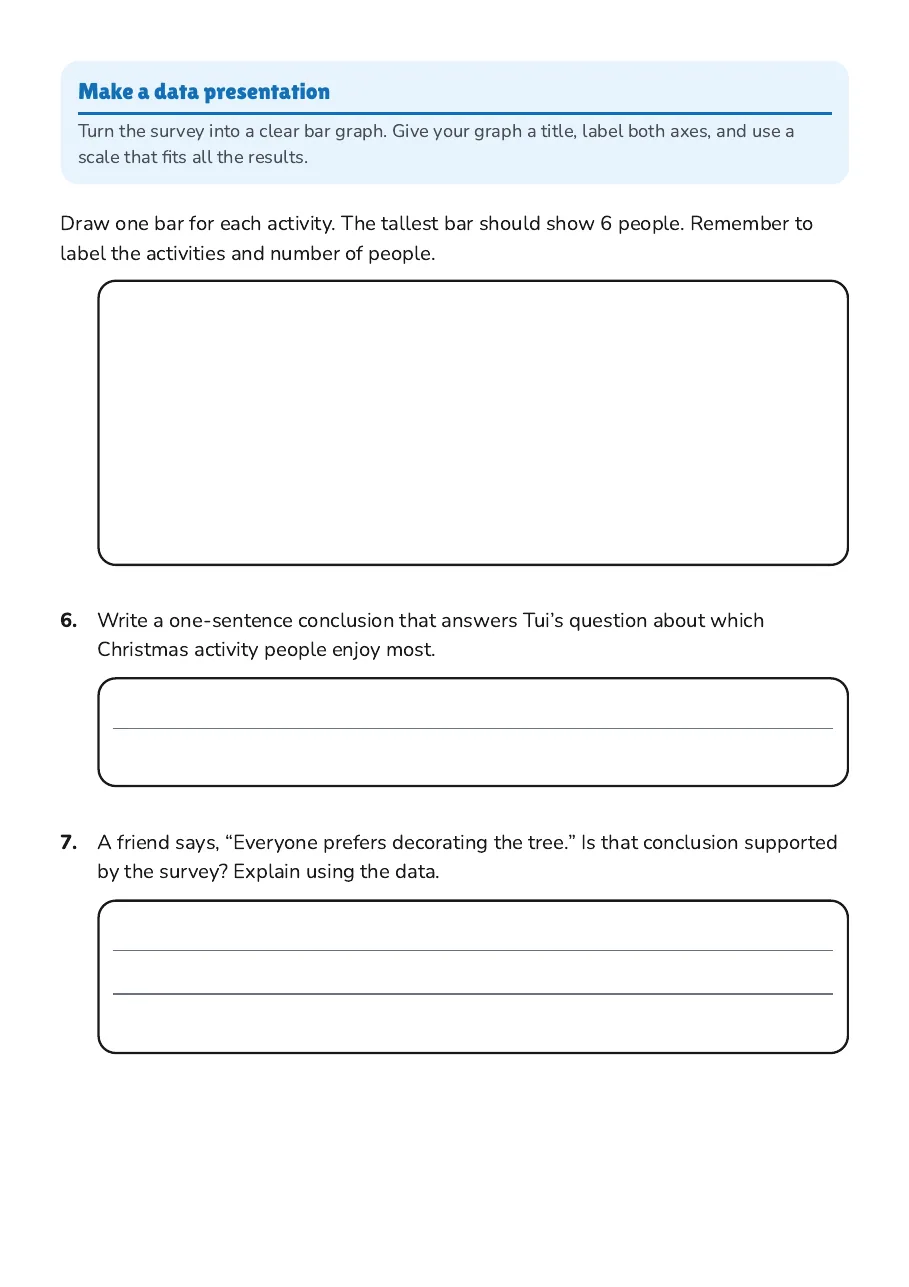
Make a data presentation

Turn the survey into a clear bar graph. Give your graph a title, label both axes, and use a scale that fits all the results.

Draw one bar for each activity. The tallest bar should show 6 people. Remember to label the activities and number of people.
6.Write a one-sentence conclusion that answers Tui’s question about which Christmas activity people enjoy most.
7.A friend says, “Everyone prefers decorating the tree.” Is that conclusion supported by the survey? Explain using the data.
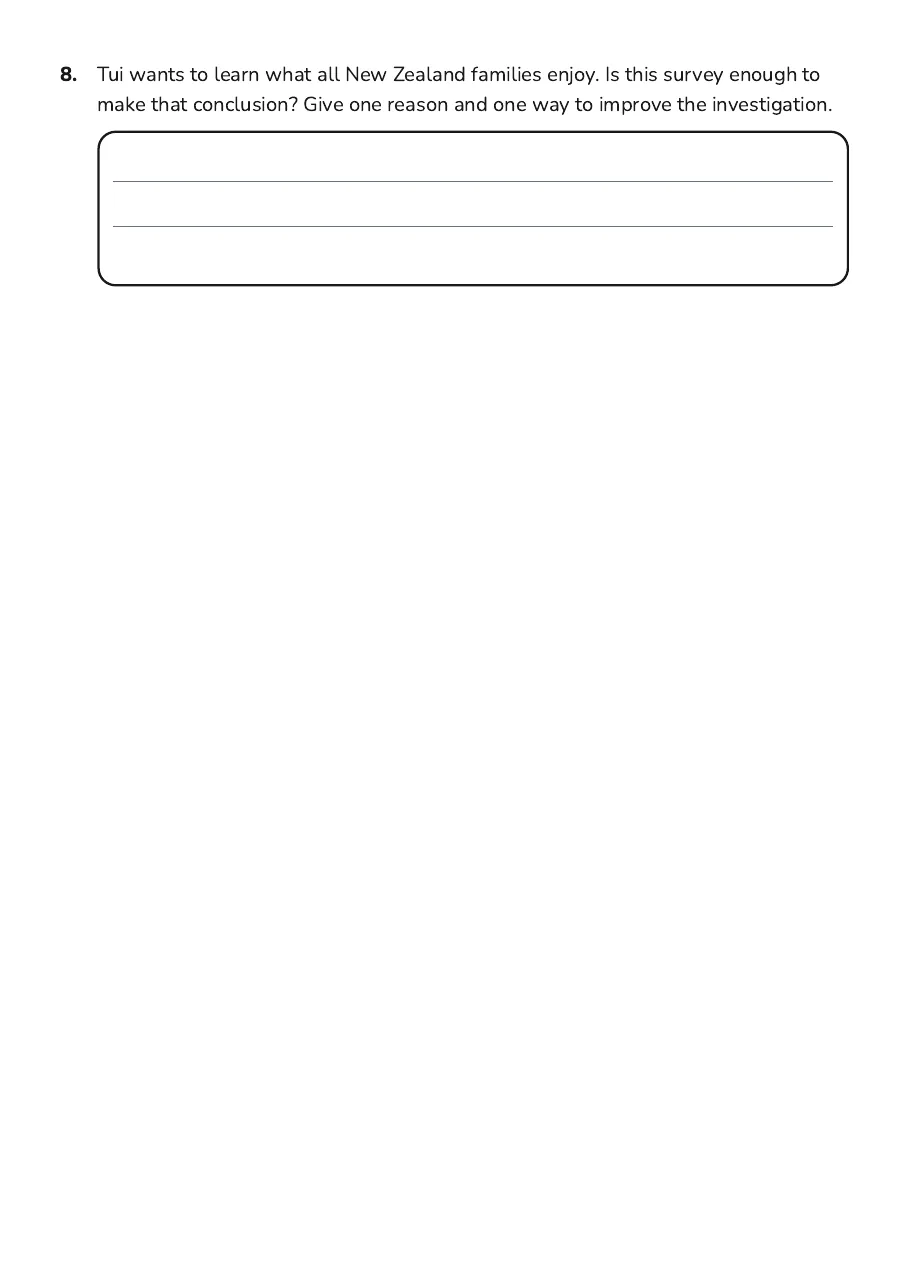
8.Tui wants to learn what all New Zealand families enjoy. Is this survey enough to make that conclusion? Give one reason and one way to improve the investigation.

4 printable pages

  • Christmas Data Presentations, page 1 of 4: Read and reason

    Page 1

  • Christmas Data Presentations, page 2 of 4: 2. Which activity was the most popular, and how many people chose it?

    Page 2

  • Christmas Data Presentations, page 3 of 4: Make a data presentation

    Page 3

  • Christmas Data Presentations, page 4 of 4: 8. Tui wants to learn what all New Zealand families enjoy. Is this survey enough to

    Page 4

About This Worksheet

Free in Kuraplan

Sign up free, grab the PDF, and customize it for your class.

Print-Ready

Formatted for standard paper. Clean layout, easy to read.

AI-Generated

Created with Kuraplan's AI, designed for real classroom use.

For Teachers & Parents

Use in classrooms, for homework, tutoring, or homeschool.

Need a custom version of this worksheet?

Kuraplan's AI generates custom worksheets in seconds — differentiated for every learner, aligned to your curriculum.

Generate Custom Worksheets — Free
No credit card Curriculum-aligned Under 60 seconds