MathsFreePrintable

Comparing Bar Graphs

A free maths worksheet ready for your classroom. Open in Kuraplan to grab the print-ready PDF, customize it for your students, or generate a fresh version in seconds.
Comparing Bar Graphs worksheet preview

Comparing Bar Graphs

Comparing Bar Graphs

Two colorful bar graphs showing data comparison

📊 Part 1: Looking at Bar Graphs

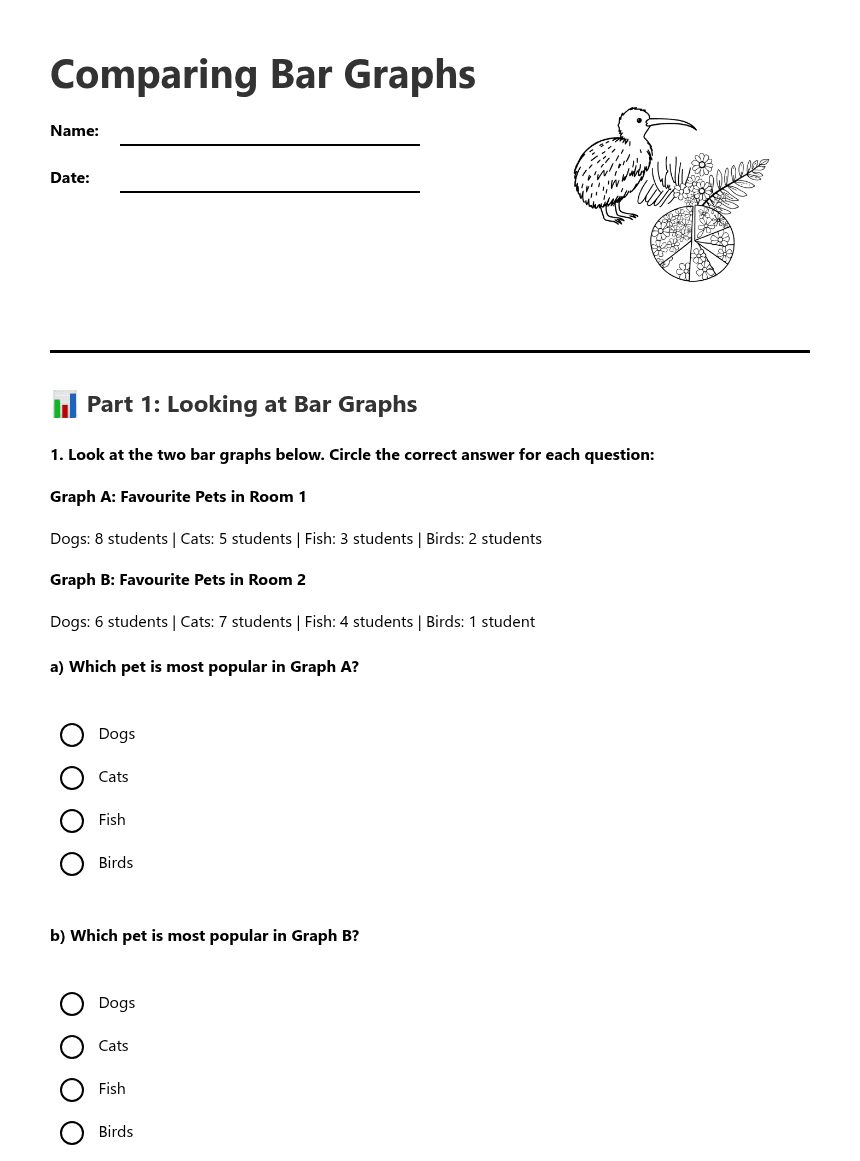
1. Look at the two bar graphs below. Circle the correct answer for each question:

Graph A: Favourite Pets in Room 1

Dogs: 8 students | Cats: 5 students | Fish: 3 students | Birds: 2 students

Graph B: Favourite Pets in Room 2

Dogs: 6 students | Cats: 7 students | Fish: 4 students | Birds: 1 student

a) Which pet is most popular in Graph A?

Dogs

Cats

Fish

Birds

b) Which pet is most popular in Graph B?

Dogs

Cats

Fish

Birds

🔍 Part 2: Comparing the Graphs

2. Compare the two graphs. Check all the statements that are true:

Room 1 has more dog lovers than Room 2

Room 2 has more cat lovers than Room 1

Both rooms have the same number of fish lovers

Room 1 has more bird lovers than Room 2

3. Fill in the blanks using the words: more, less, same, different

Room 1 has _______ dog lovers than Room 2.

Room 2 has _______ cat lovers than Room 1.

The number of fish lovers is _______ in both rooms.

The most popular pets are _______ in each room.

✏️ Part 3: Your Observations

4. Write one thing that is the SAME about both graphs:
5. Write one thing that is DIFFERENT about the two graphs:
6. Which room would you rather be in and why? Use words like more, less, same, or different in your answer:

🎨 Part 4: Create Your Own Comparison

7. Draw two simple bar graphs to show favourite colours in two different classes. Make them different from each other:

Class A Favourite Colours:

Class B Favourite Colours:

8. Write two sentences comparing your graphs using mathematical vocabulary:

🤔 Part 5: Thinking Questions

9. Match each comparison word with its meaning:
1. More
2. Less
3. Same
4. Different
A. Not alike
B. A bigger amount
C. Equal amounts
D. A smaller amount
10. Why is it helpful to compare two bar graphs? Write your answer:

About This Worksheet

Free in Kuraplan

Sign up free, grab the PDF, and customize it for your class.

Print-Ready

Formatted for standard paper. Clean layout, easy to read.

AI-Generated

Created with Kuraplan's AI, designed for real classroom use.

For Teachers & Parents

Use in classrooms, for homework, tutoring, or homeschool.

Need a custom version of this worksheet?

Kuraplan's AI generates custom worksheets in seconds — differentiated for every learner, aligned to your curriculum.

Generate Custom Worksheets — Free


No credit card Curriculum-aligned Under 60 seconds





