MathsFreePrintable

Data Art Investigation Programme

A free maths worksheet ready for your classroom. Open in Kuraplan to grab the print-ready PDF, customize it for your students, or generate a fresh version in seconds.
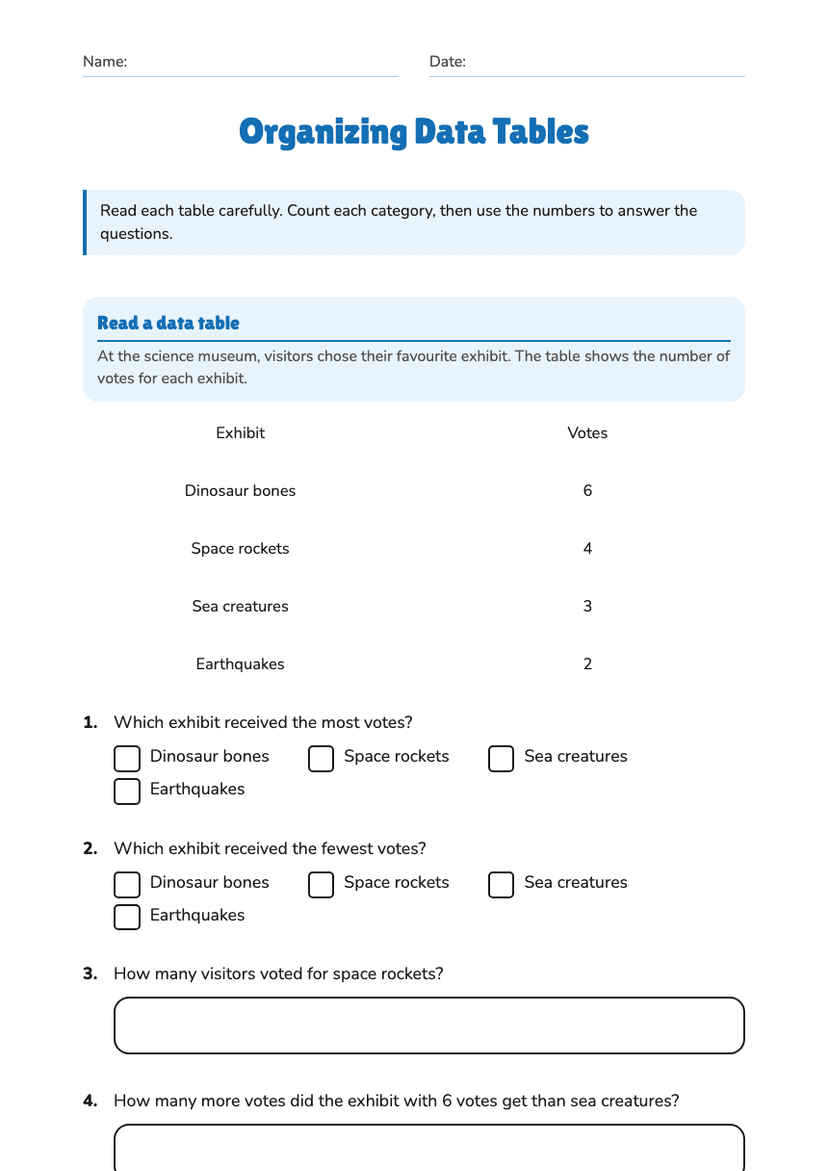
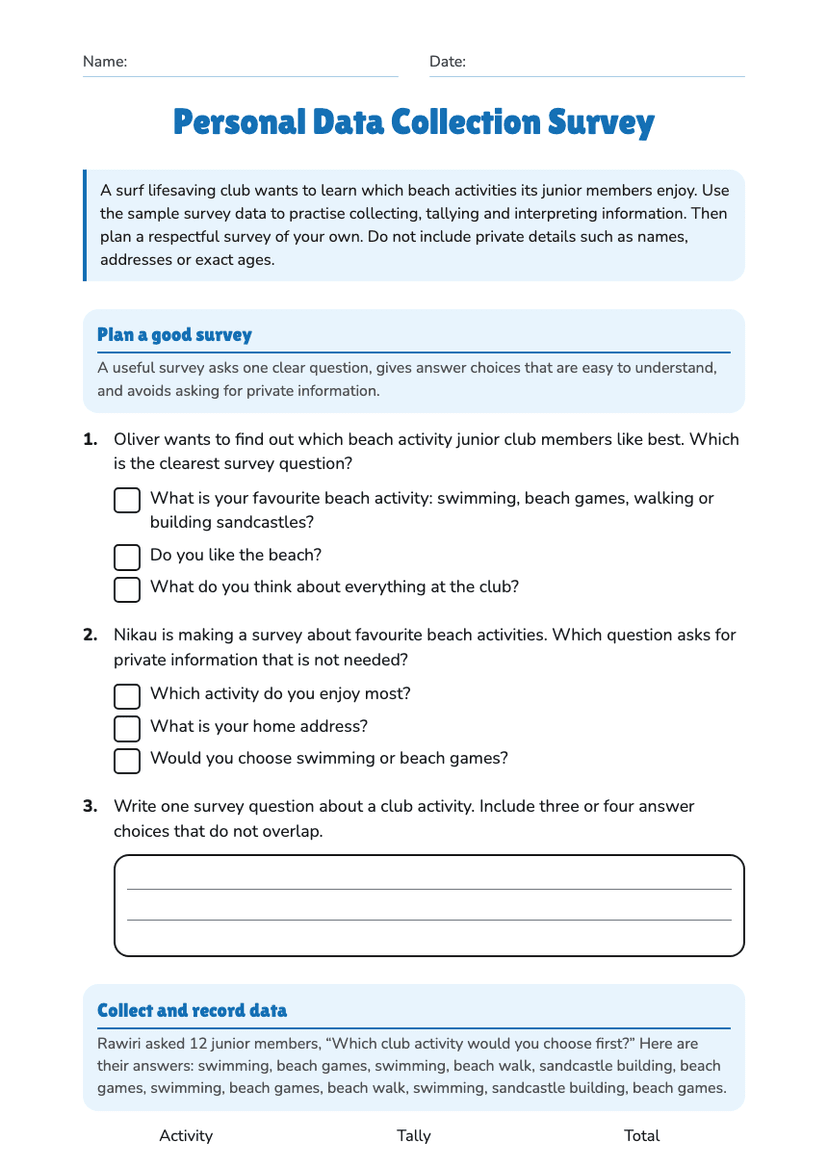
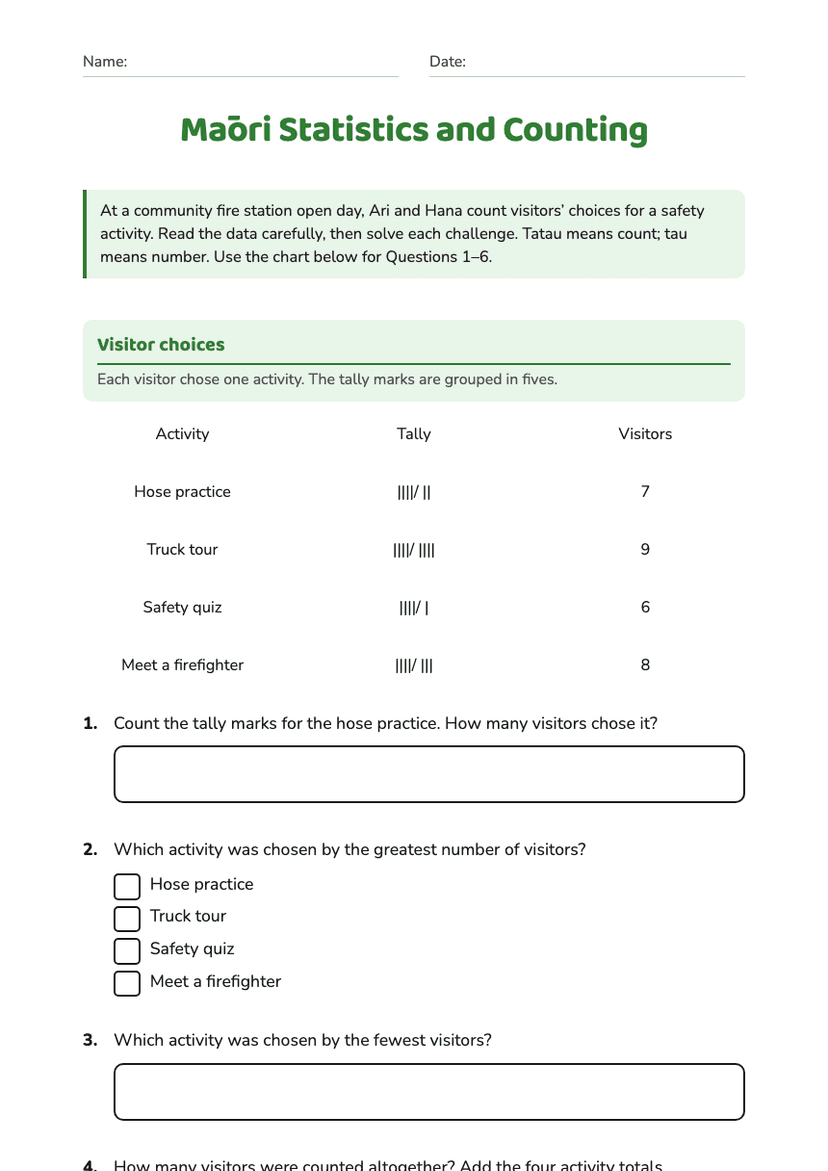
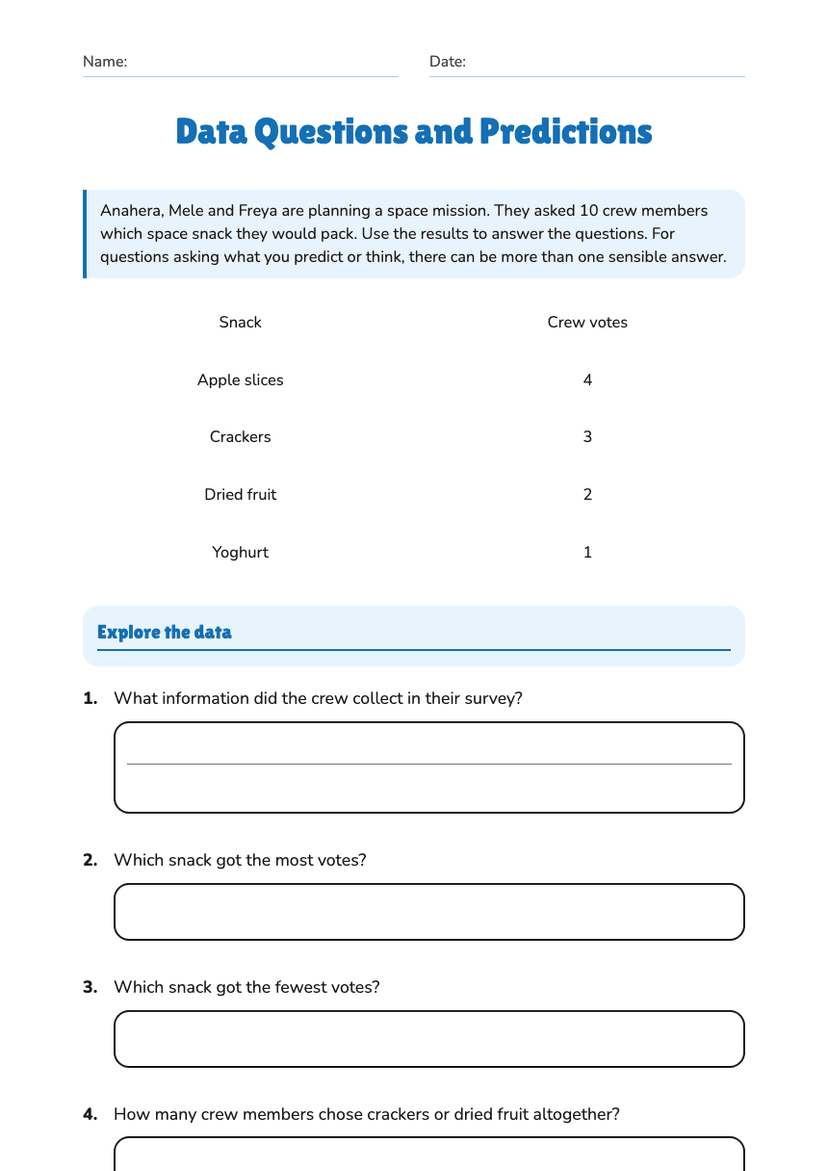
Data Art Investigation Programme worksheet preview
Name:Date:

Data Art Investigation Programme

Use the evidence in the questions to investigate, interpret and present data. Show your working where needed. For open-ended questions, give a sensible example.

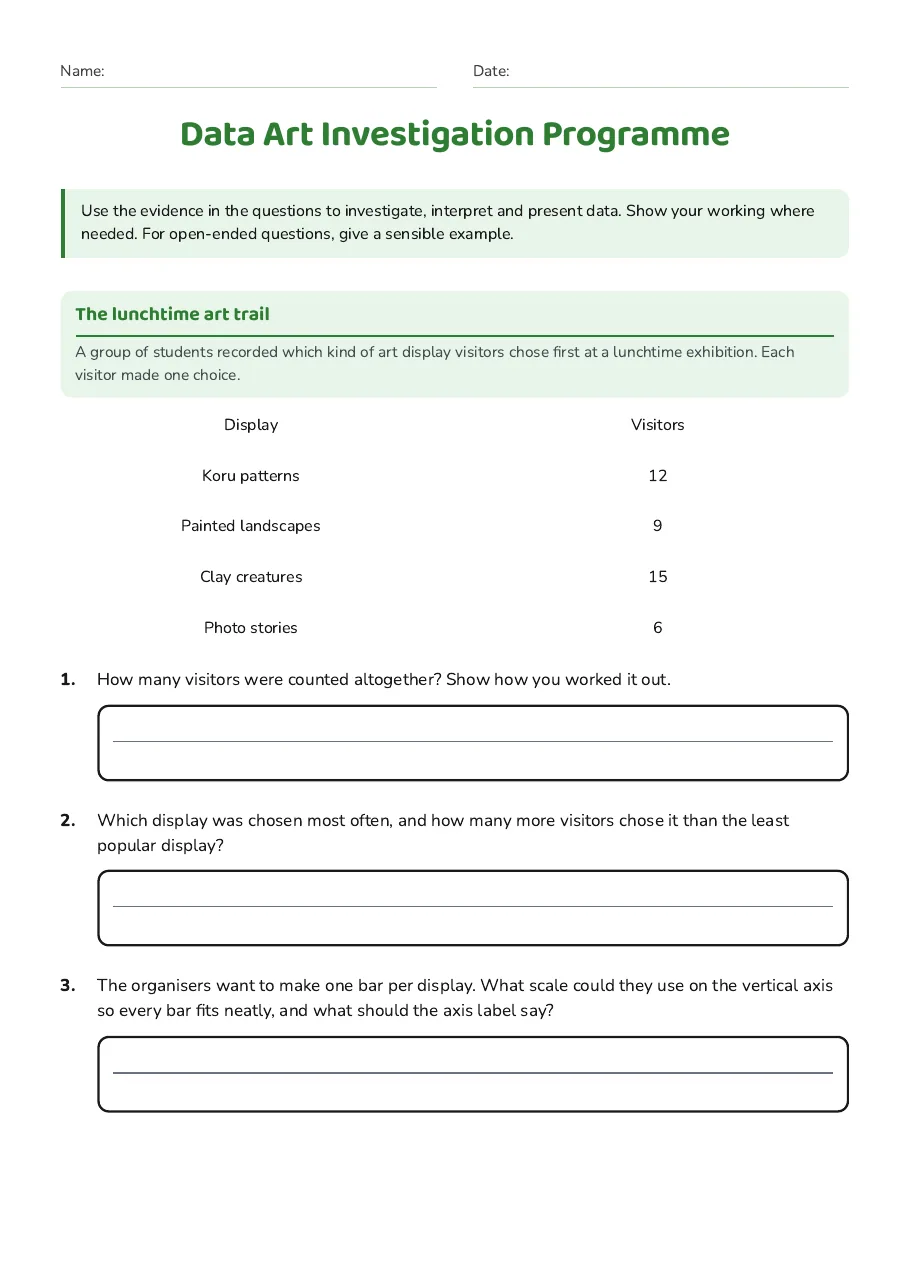
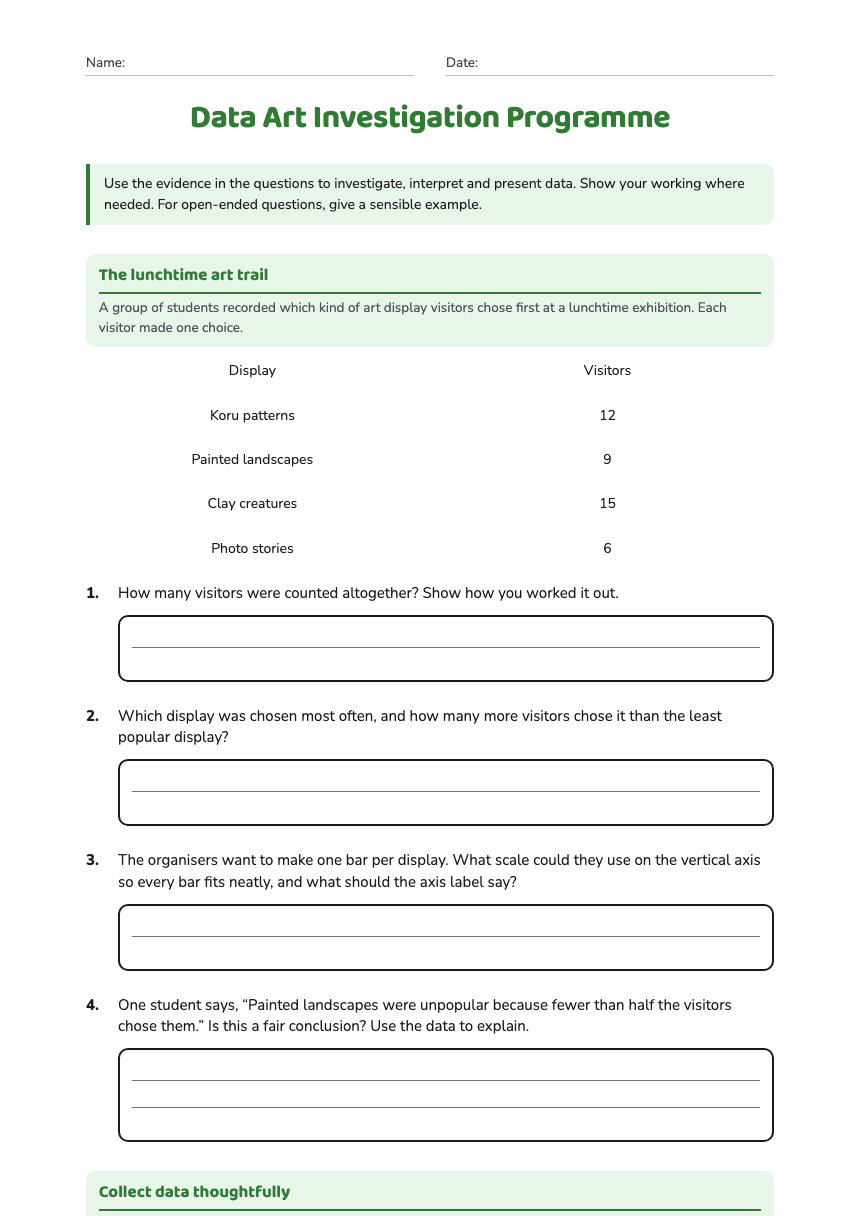
The lunchtime art trail

A group of students recorded which kind of art display visitors chose first at a lunchtime exhibition. Each visitor made one choice.

Display

Visitors

Koru patterns

12

Painted landscapes

9

Clay creatures

15

Photo stories

6

1.How many visitors were counted altogether? Show how you worked it out.
2.Which display was chosen most often, and how many more visitors chose it than the least popular display?
3.The organisers want to make one bar per display. What scale could they use on the vertical axis so every bar fits neatly, and what should the axis label say?
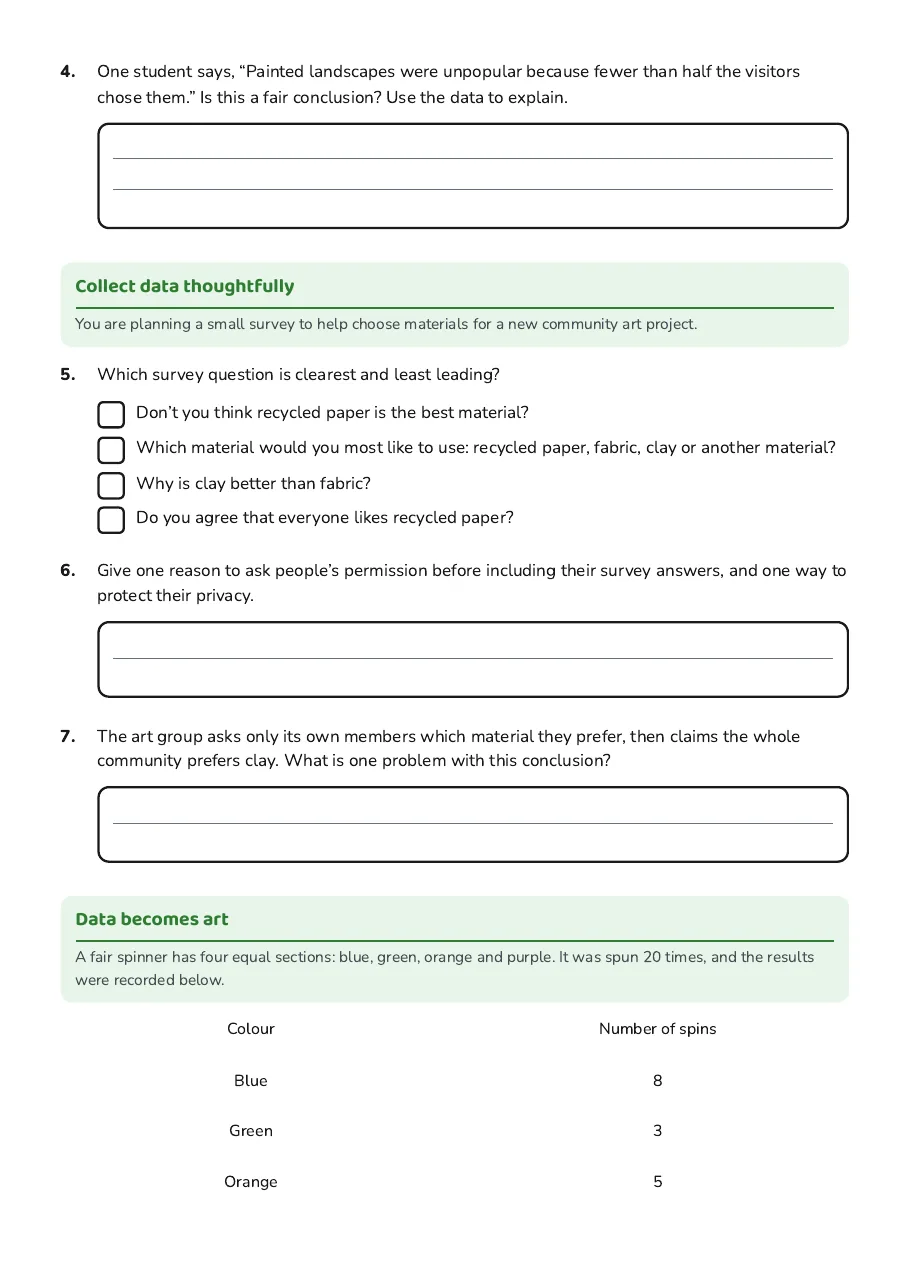
4.One student says, “Painted landscapes were unpopular because fewer than half the visitors chose them.” Is this a fair conclusion? Use the data to explain.

Collect data thoughtfully

You are planning a small survey to help choose materials for a new community art project.

5.Which survey question is clearest and least leading?
  • Don’t you think recycled paper is the best material?
  • Which material would you most like to use: recycled paper, fabric, clay or another material?
  • Why is clay better than fabric?
  • Do you agree that everyone likes recycled paper?
6.Give one reason to ask people’s permission before including their survey answers, and one way to protect their privacy.
7.The art group asks only its own members which material they prefer, then claims the whole community prefers clay. What is one problem with this conclusion?

Data becomes art

A fair spinner has four equal sections: blue, green, orange and purple. It was spun 20 times, and the results were recorded below.

Colour

Number of spins

Blue

8

Green

3

Orange

5

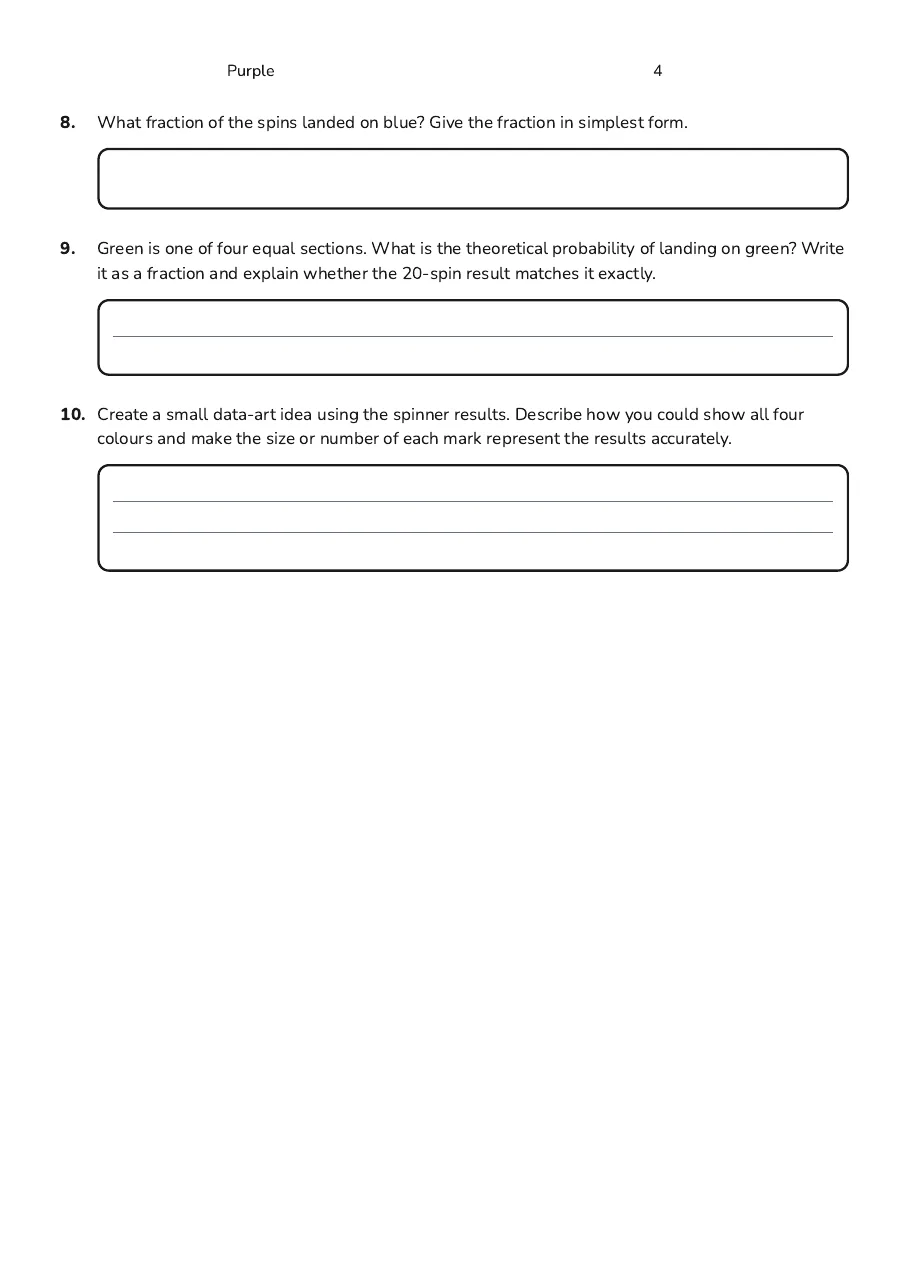
Purple

4

8.What fraction of the spins landed on blue? Give the fraction in simplest form.
9.Green is one of four equal sections. What is the theoretical probability of landing on green? Write it as a fraction and explain whether the 20-spin result matches it exactly.
10.Create a small data-art idea using the spinner results. Describe how you could show all four colours and make the size or number of each mark represent the results accurately.

3 printable pages

  • Data Art Investigation Programme, page 1 of 3: The lunchtime art trail

    Page 1

  • Data Art Investigation Programme, page 2 of 3: Collect data thoughtfully, Data becomes art

    Page 2

  • Data Art Investigation Programme, page 3 of 3: Purple 4

    Page 3

About This Worksheet

Free in Kuraplan

Sign up free, grab the PDF, and customize it for your class.

Print-Ready

Formatted for standard paper. Clean layout, easy to read.

AI-Generated

Created with Kuraplan's AI, designed for real classroom use.

For Teachers & Parents

Use in classrooms, for homework, tutoring, or homeschool.

Need a custom version of this worksheet?

Kuraplan's AI generates custom worksheets in seconds — differentiated for every learner, aligned to your curriculum.

Generate Custom Worksheets — Free
No credit card Curriculum-aligned Under 60 seconds