Data Collection and Graphs
A free maths worksheet ready for your classroom. Open in Kuraplan to grab the print-ready PDF, customize it for your students, or generate a fresh version in seconds.
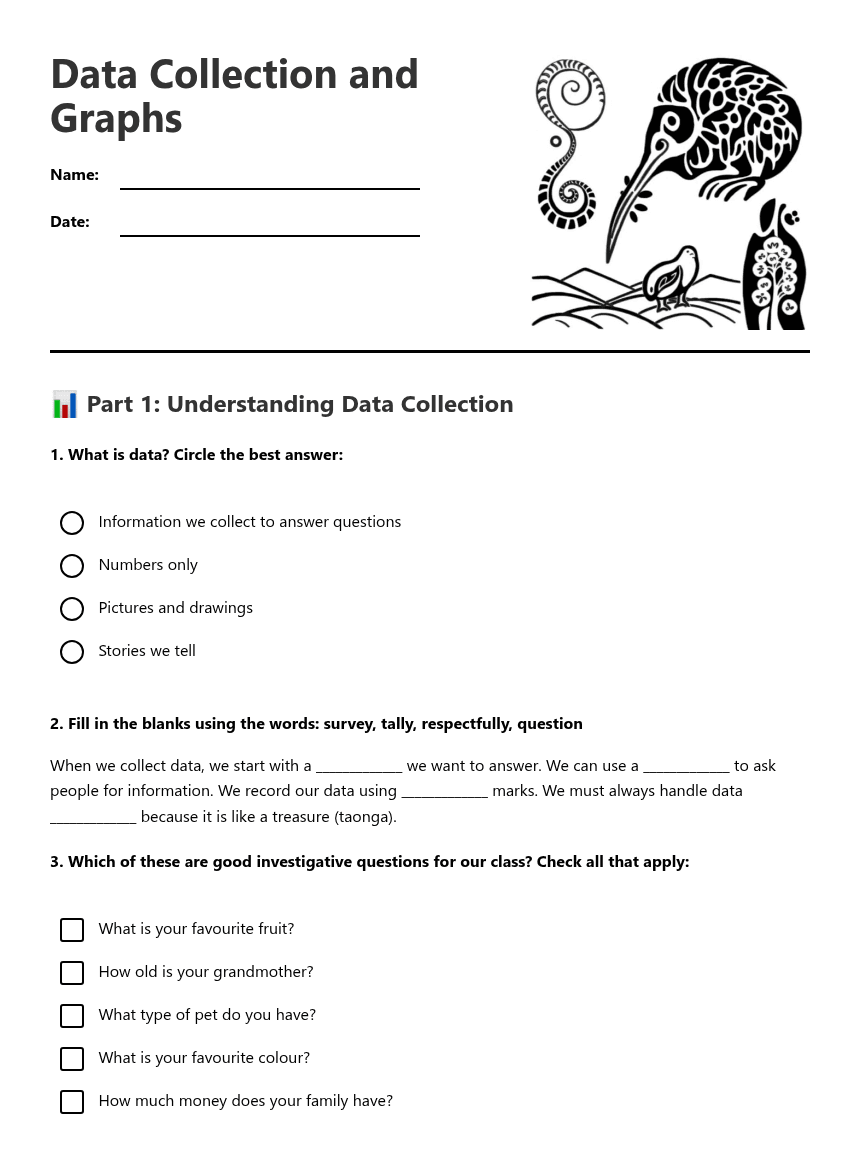
Data Collection and Graphs

📊 Part 1: Understanding Data Collection
When we collect data, we start with a _____________ we want to answer. We can use a _____________ to ask people for information. We record our data using _____________ marks. We must always handle data _____________ because it is like a treasure (taonga).
📝 Part 2: Tally Charts and Recording Data
Rugby: |||| ||||
Netball: |||| ||
Swimming: ||||
Football: |||| |||
Rugby: _______ students
Netball: _______ students
Swimming: _______ students
Football: _______ students
📈 Part 3: Creating Column Graphs
• Label your axes (bottom and side)
• Give your graph a title
• Make columns the same width
• Use the correct height for each column
✍️ Part 4: Analysing and Summarising Data
Sentence 1: The most popular sport in our class is _________________________ because _________________________ students chose it.
Sentence 2: The least popular sport is _________________________ with only _________________________ students choosing it.
🌟 Part 5: Te Reo Māori Data Vocabulary
English: Data is a _____________ that we must handle with _____________.
Te reo Māori: He _____________ te raraunga, me _____________ hoki.
About This Worksheet
Free in Kuraplan
Sign up free, grab the PDF, and customize it for your class.
Print-Ready
Formatted for standard paper. Clean layout, easy to read.
AI-Generated
Created with Kuraplan's AI, designed for real classroom use.
For Teachers & Parents
Use in classrooms, for homework, tutoring, or homeschool.
Need a custom version of this worksheet?
Kuraplan's AI generates custom worksheets in seconds — differentiated for every learner, aligned to your curriculum.
Generate Custom Worksheets — Free






