MathsFreePrintable

Data Collection Survey Activity

A free maths worksheet ready for your classroom. Open in Kuraplan to grab the print-ready PDF, customize it for your students, or generate a fresh version in seconds.
Data Collection Survey Activity worksheet preview
Name:Date:

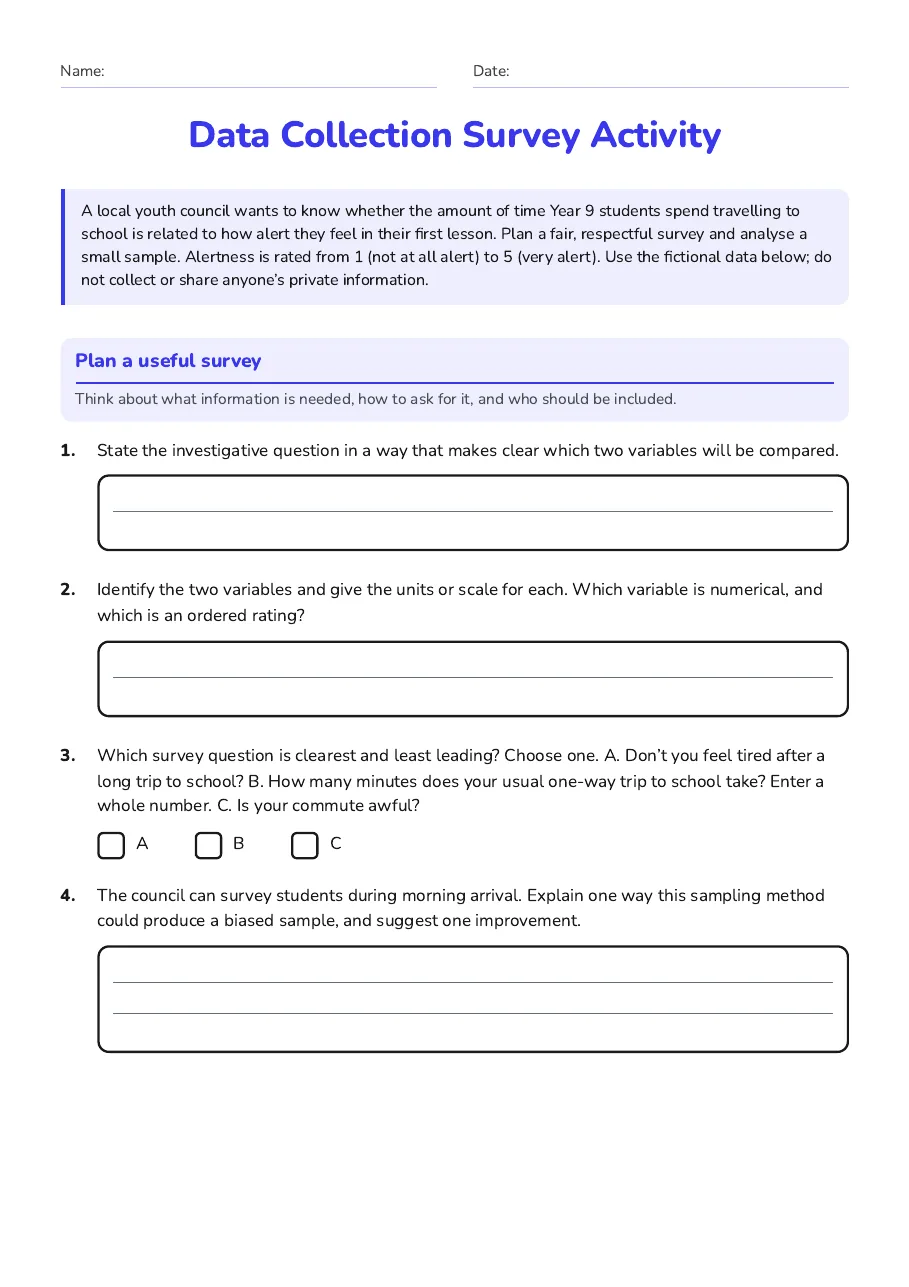
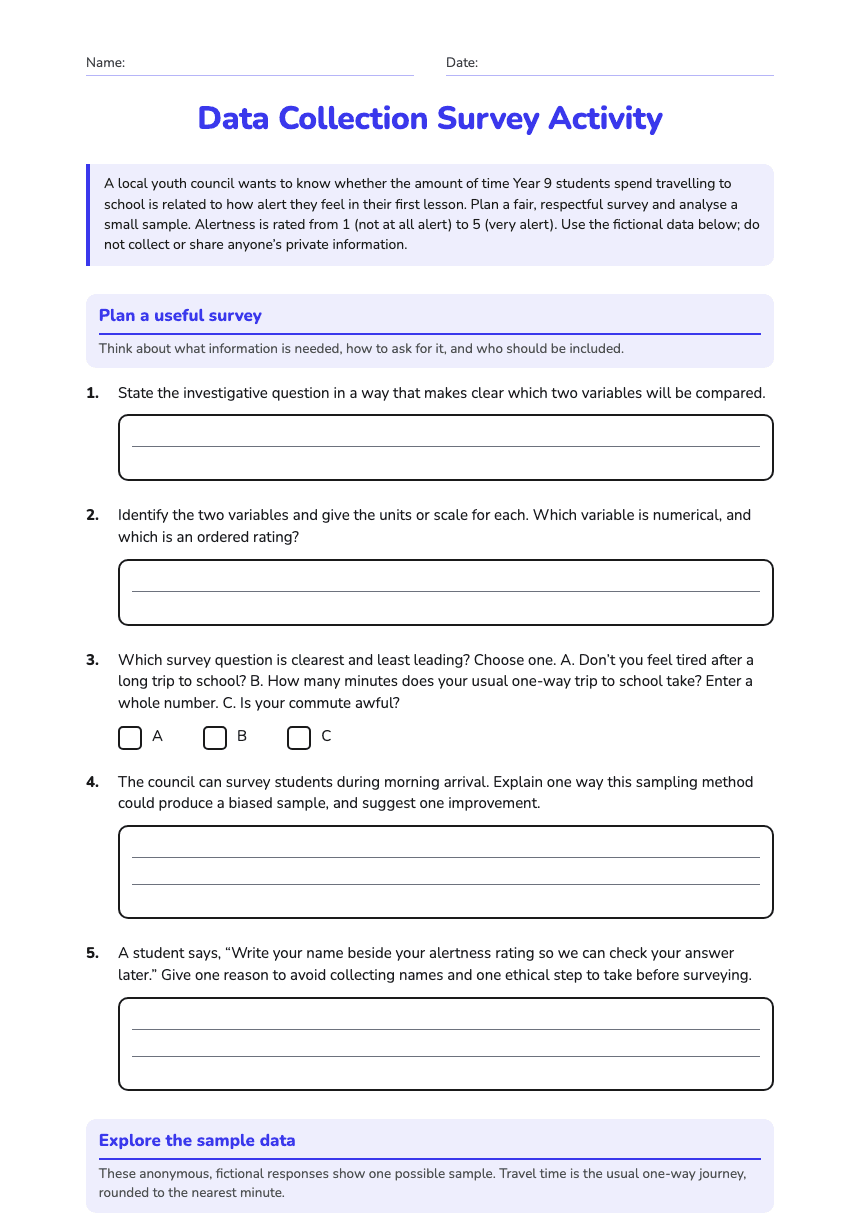
Data Collection Survey Activity

A local youth council wants to know whether the amount of time Year 9 students spend travelling to school is related to how alert they feel in their first lesson. Plan a fair, respectful survey and analyse a small sample. Alertness is rated from 1 (not at all alert) to 5 (very alert). Use the fictional data below; do not collect or share anyone’s private information.

Plan a useful survey

Think about what information is needed, how to ask for it, and who should be included.

1.State the investigative question in a way that makes clear which two variables will be compared.
2.Identify the two variables and give the units or scale for each. Which variable is numerical, and which is an ordered rating?
3.Which survey question is clearest and least leading? Choose one. A. Don’t you feel tired after a long trip to school? B. How many minutes does your usual one-way trip to school take? Enter a whole number. C. Is your commute awful?
  • A
  • B
  • C
4.The council can survey students during morning arrival. Explain one way this sampling method could produce a biased sample, and suggest one improvement.
5.A student says, “Write your name beside your alertness rating so we can check your answer later.” Give one reason to avoid collecting names and one ethical step to take before surveying.

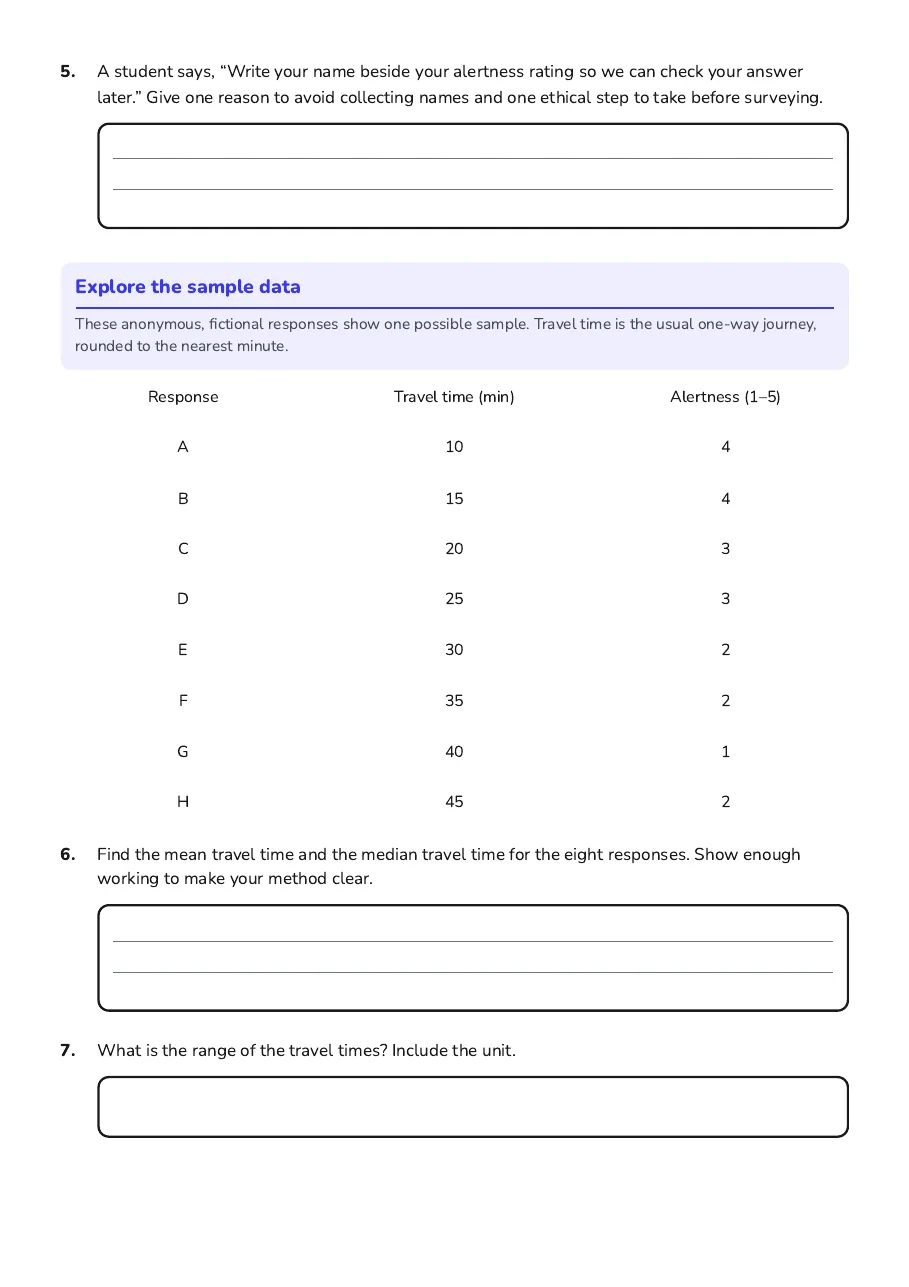
Explore the sample data

These anonymous, fictional responses show one possible sample. Travel time is the usual one-way journey, rounded to the nearest minute.

Response

Travel time (min)

Alertness (1–5)

A

10

4

B

15

4

C

20

3

D

25

3

E

30

2

F

35

2

G

40

1

H

45

2

6.Find the mean travel time and the median travel time for the eight responses. Show enough working to make your method clear.
7.What is the range of the travel times? Include the unit.
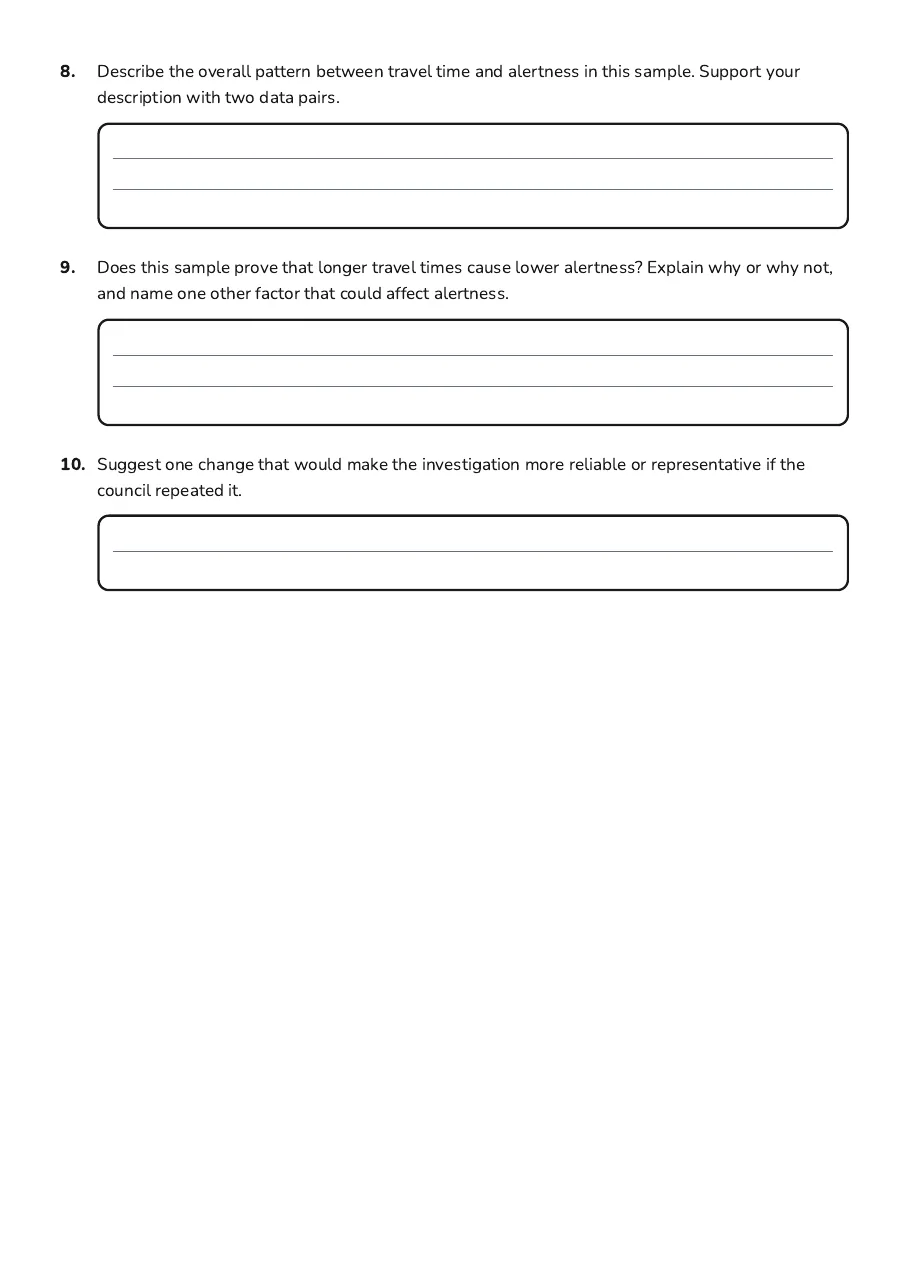
8.Describe the overall pattern between travel time and alertness in this sample. Support your description with two data pairs.
9.Does this sample prove that longer travel times cause lower alertness? Explain why or why not, and name one other factor that could affect alertness.
10.Suggest one change that would make the investigation more reliable or representative if the council repeated it.

3 printable pages

  • Data Collection Survey Activity, page 1 of 3: Plan a useful survey

    Page 1

  • Data Collection Survey Activity, page 2 of 3: Explore the sample data

    Page 2

  • Data Collection Survey Activity, page 3 of 3: 8. Describe the overall pattern between travel time and alertness in this sample. Support…

    Page 3

About This Worksheet

Free in Kuraplan

Sign up free, grab the PDF, and customize it for your class.

Print-Ready

Formatted for standard paper. Clean layout, easy to read.

AI-Generated

Created with Kuraplan's AI, designed for real classroom use.

For Teachers & Parents

Use in classrooms, for homework, tutoring, or homeschool.

Need a custom version of this worksheet?

Kuraplan's AI generates custom worksheets in seconds — differentiated for every learner, aligned to your curriculum.

Generate Custom Worksheets — Free
No credit card Curriculum-aligned Under 60 seconds