MathsFreePrintable

Data Detective Inquiry Worksheet

A free maths worksheet ready for your classroom. Open in Kuraplan to grab the print-ready PDF, customize it for your students, or generate a fresh version in seconds.
Data Detective Inquiry Worksheet worksheet preview
Name:Date:

Data Detective Inquiry Worksheet

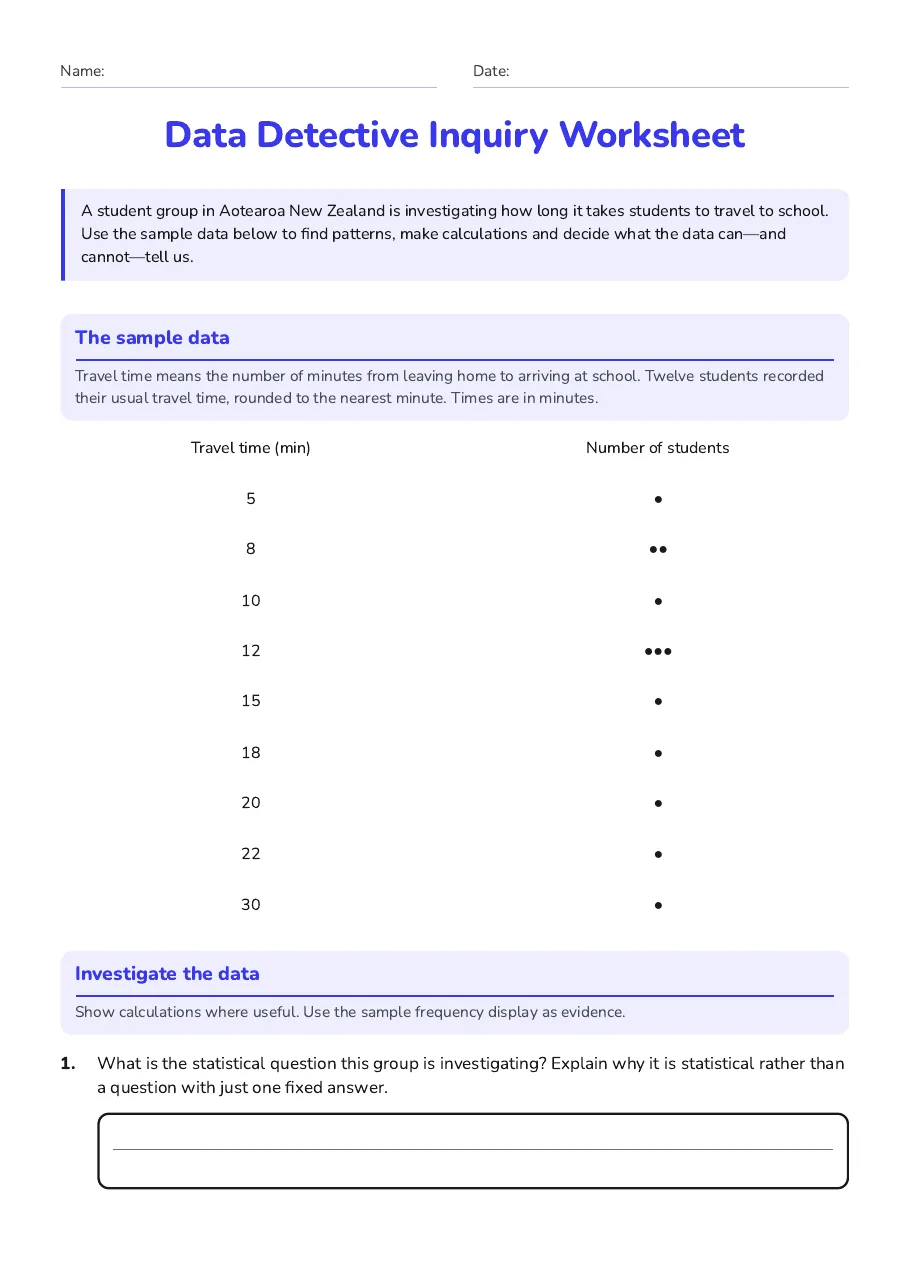
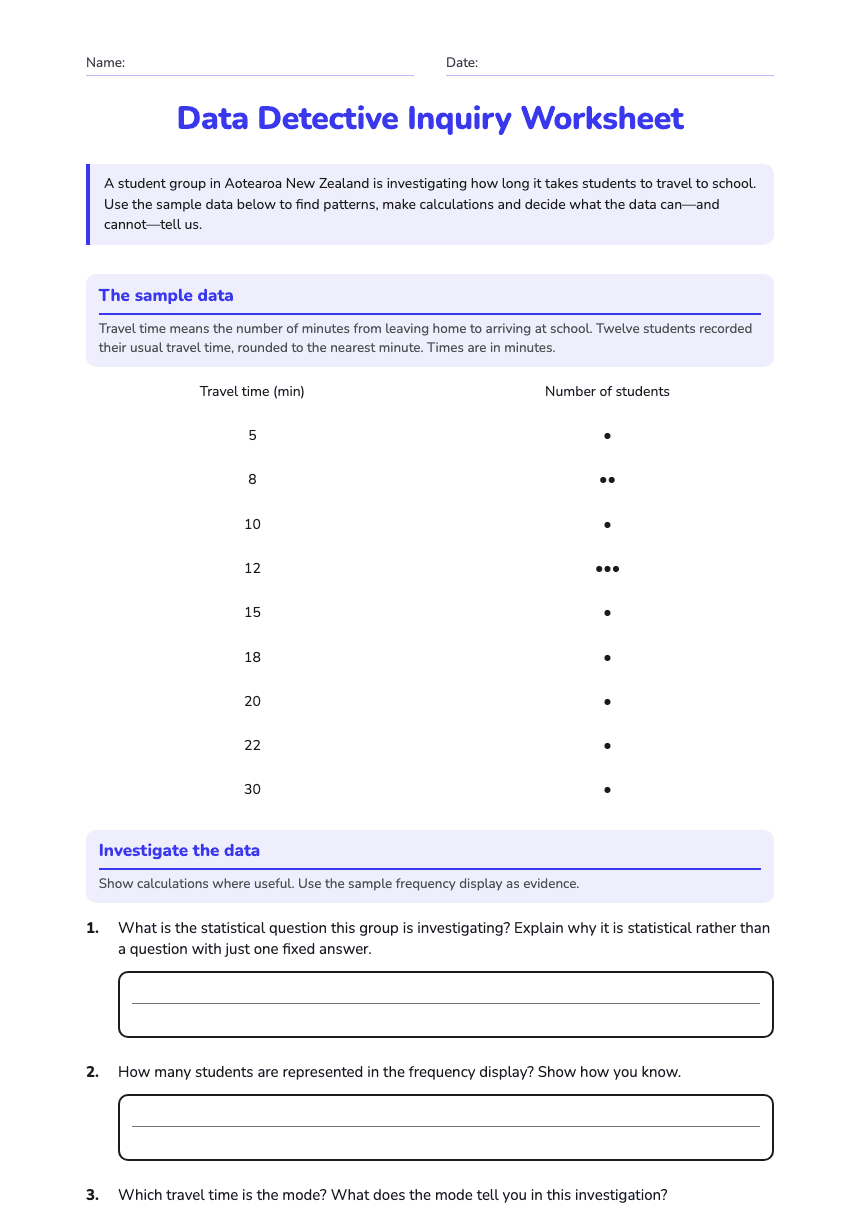
A student group in Aotearoa New Zealand is investigating how long it takes students to travel to school. Use the sample data below to find patterns, make calculations and decide what the data can—and cannot—tell us.

The sample data

Travel time means the number of minutes from leaving home to arriving at school. Twelve students recorded their usual travel time, rounded to the nearest minute. Times are in minutes.

Travel time (min)

Number of students

5

●

8

●●

10

●

12

●●●

15

●

18

●

20

●

22

●

30

●

Investigate the data

Show calculations where useful. Use the sample frequency display as evidence.

1.What is the statistical question this group is investigating? Explain why it is statistical rather than a question with just one fixed answer.
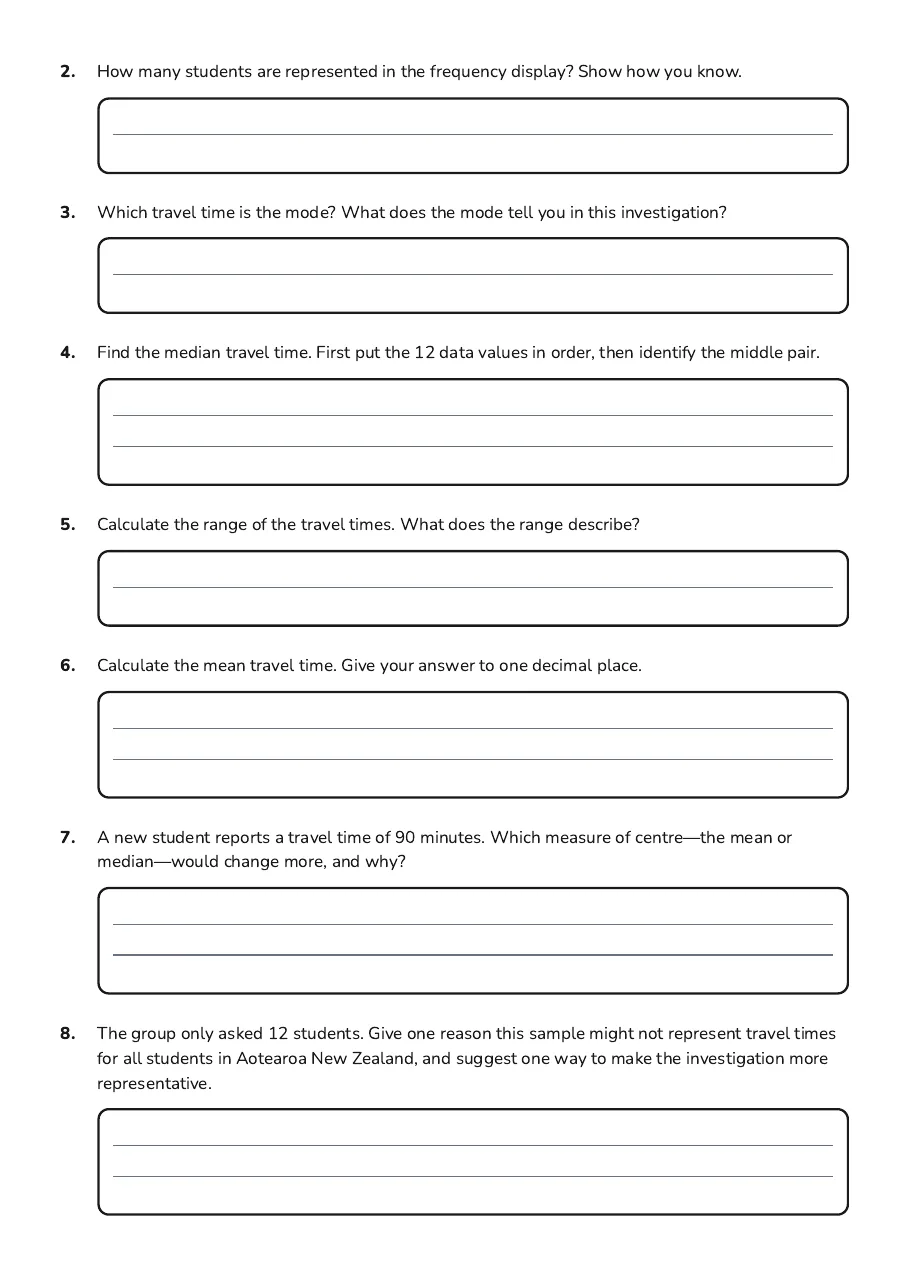
2.How many students are represented in the frequency display? Show how you know.
3.Which travel time is the mode? What does the mode tell you in this investigation?
4.Find the median travel time. First put the 12 data values in order, then identify the middle pair.
5.Calculate the range of the travel times. What does the range describe?
6.Calculate the mean travel time. Give your answer to one decimal place.
7.A new student reports a travel time of 90 minutes. Which measure of centre—the mean or median—would change more, and why?
8.The group only asked 12 students. Give one reason this sample might not represent travel times for all students in Aotearoa New Zealand, and suggest one way to make the investigation more representative.
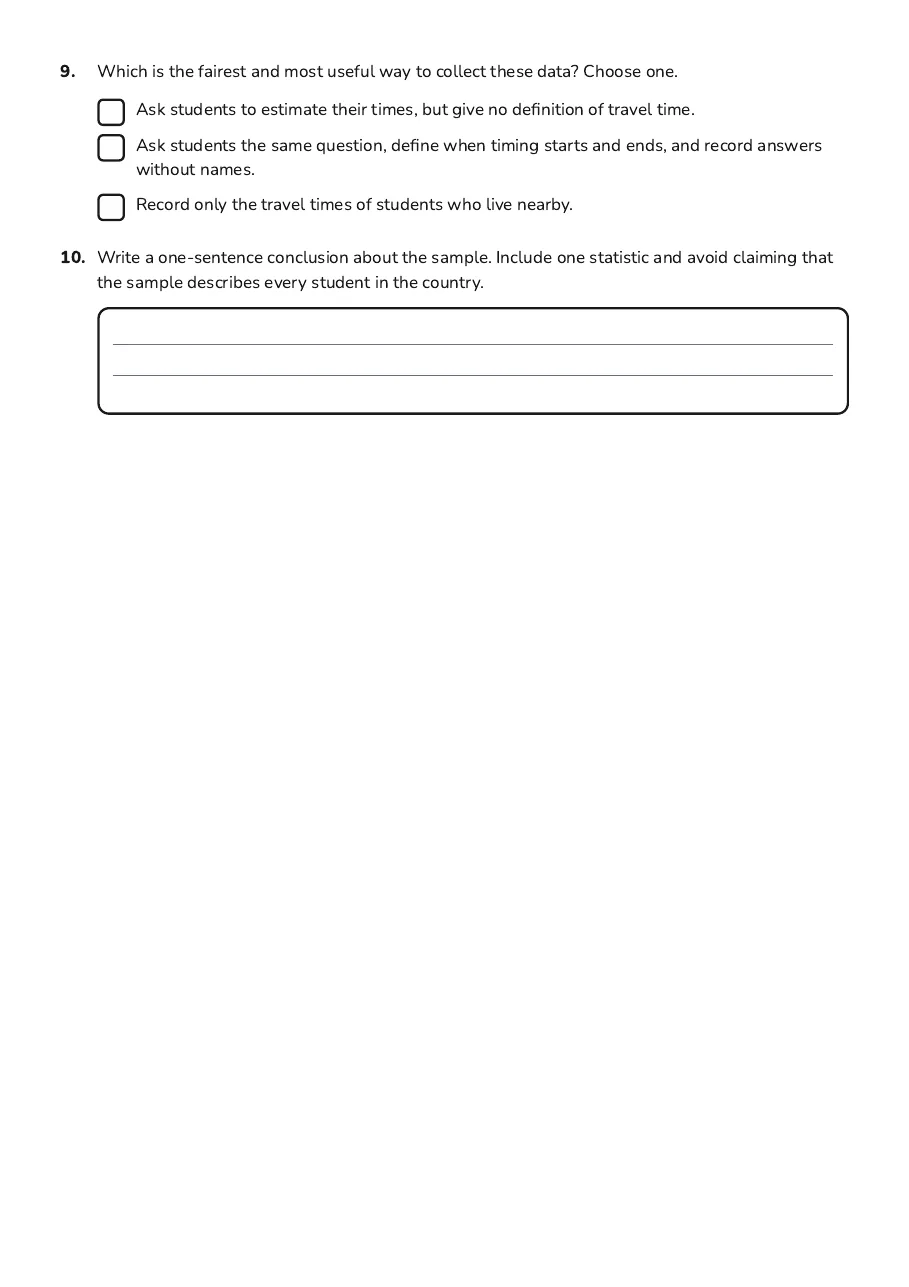
9.Which is the fairest and most useful way to collect these data? Choose one.
  • Ask students to estimate their times, but give no definition of travel time.
  • Ask students the same question, define when timing starts and ends, and record answers without names.
  • Record only the travel times of students who live nearby.
10.Write a one-sentence conclusion about the sample. Include one statistic and avoid claiming that the sample describes every student in the country.

3 printable pages

  • Data Detective Inquiry Worksheet, page 1 of 3: The sample data, Investigate the data

    Page 1

  • Data Detective Inquiry Worksheet, page 2 of 3: 2. How many students are represented in the frequency display? Show how you know.

    Page 2

  • Data Detective Inquiry Worksheet, page 3 of 3: 9. Which is the fairest and most useful way to collect these data? Choose one.

    Page 3

About This Worksheet

Free in Kuraplan

Sign up free, grab the PDF, and customize it for your class.

Print-Ready

Formatted for standard paper. Clean layout, easy to read.

AI-Generated

Created with Kuraplan's AI, designed for real classroom use.

For Teachers & Parents

Use in classrooms, for homework, tutoring, or homeschool.

Need a custom version of this worksheet?

Kuraplan's AI generates custom worksheets in seconds — differentiated for every learner, aligned to your curriculum.

Generate Custom Worksheets — Free
No credit card Curriculum-aligned Under 60 seconds