MathsFreePrintable

Data Features Analysis

A free maths worksheet ready for your classroom. Open in Kuraplan to grab the print-ready PDF, customize it for your students, or generate a fresh version in seconds.
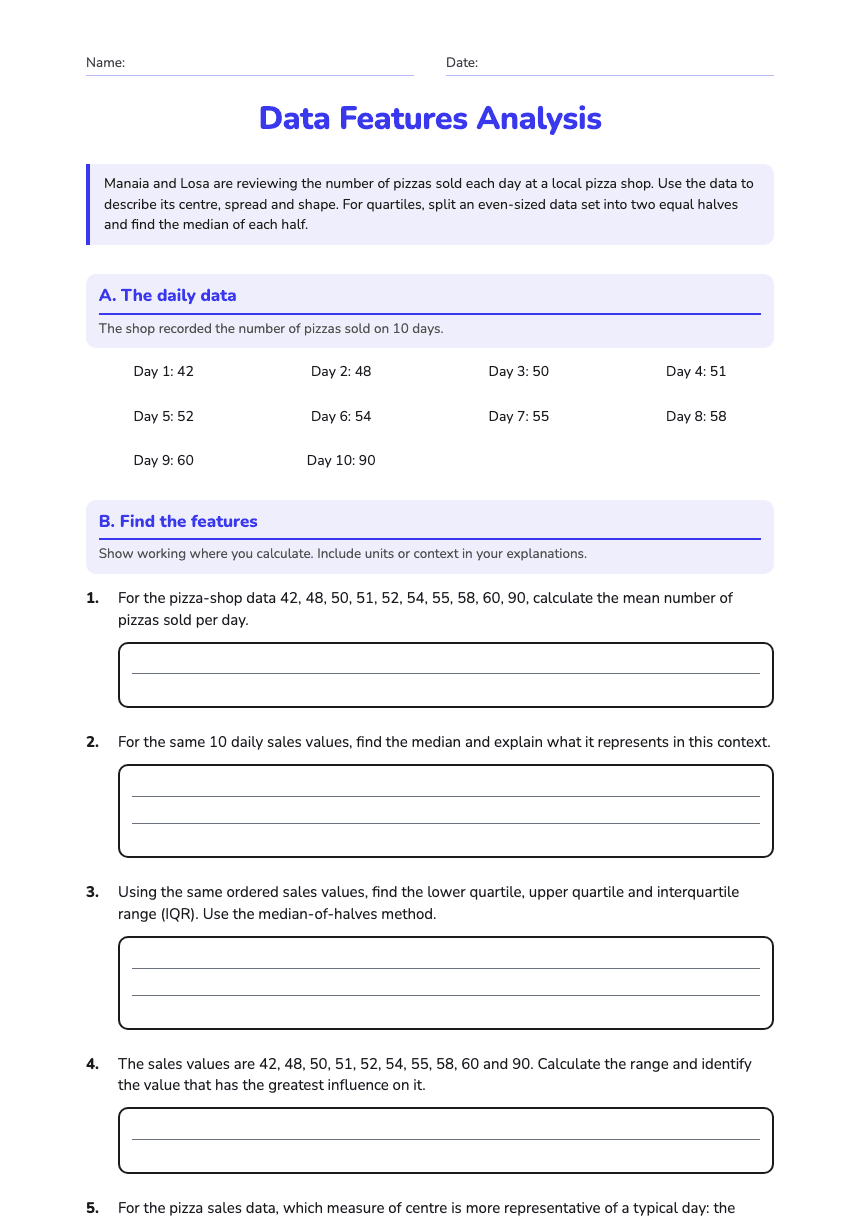
Data Features Analysis worksheet preview
Name:Date:

Data Features Analysis

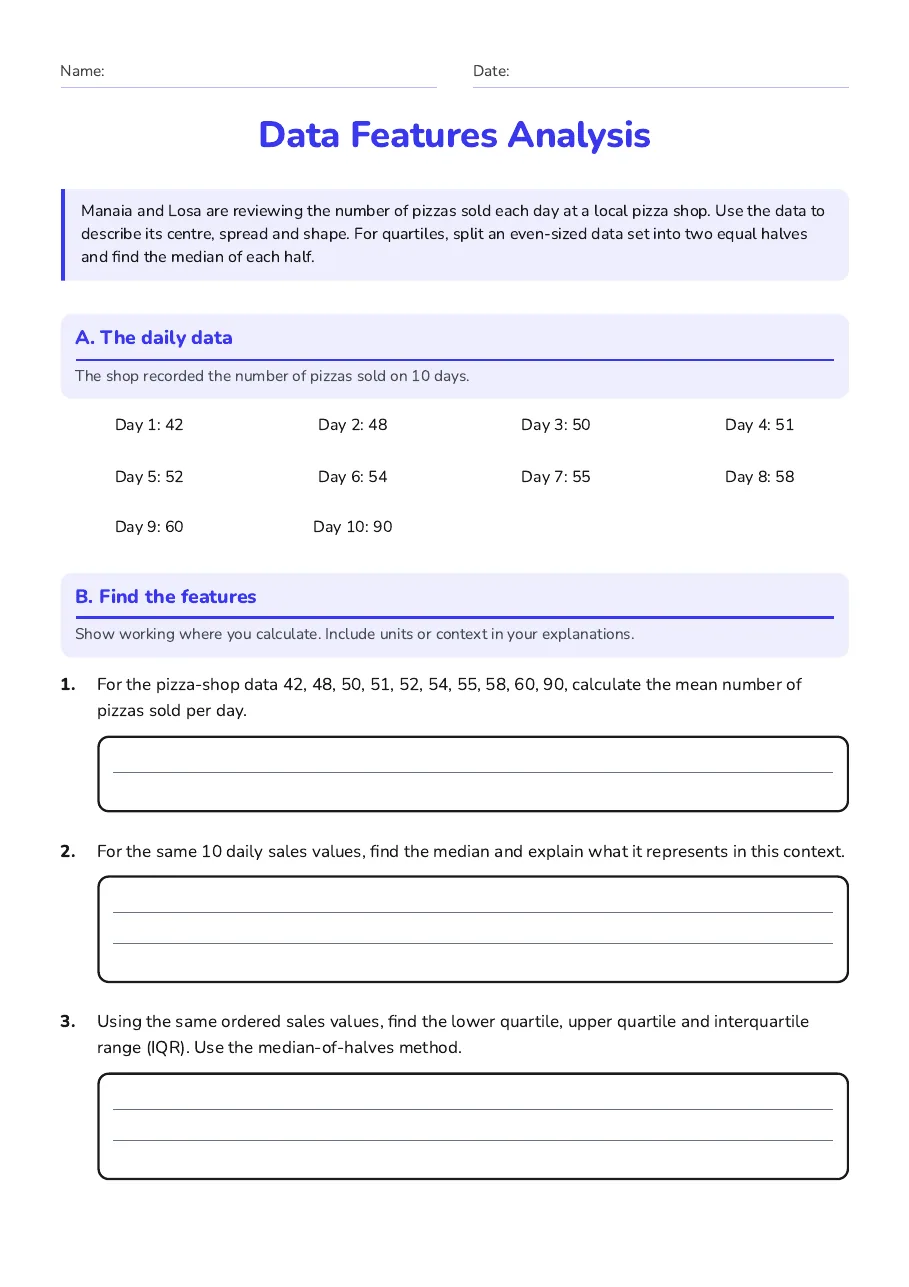
Manaia and Losa are reviewing the number of pizzas sold each day at a local pizza shop. Use the data to describe its centre, spread and shape. For quartiles, split an even-sized data set into two equal halves and find the median of each half.

A. The daily data

The shop recorded the number of pizzas sold on 10 days.

Day 1: 42

Day 2: 48

Day 3: 50

Day 4: 51

Day 5: 52

Day 6: 54

Day 7: 55

Day 8: 58

Day 9: 60

Day 10: 90

B. Find the features

Show working where you calculate. Include units or context in your explanations.

1.For the pizza-shop data 42, 48, 50, 51, 52, 54, 55, 58, 60, 90, calculate the mean number of pizzas sold per day.
2.For the same 10 daily sales values, find the median and explain what it represents in this context.
3.Using the same ordered sales values, find the lower quartile, upper quartile and interquartile range (IQR). Use the median-of-halves method.
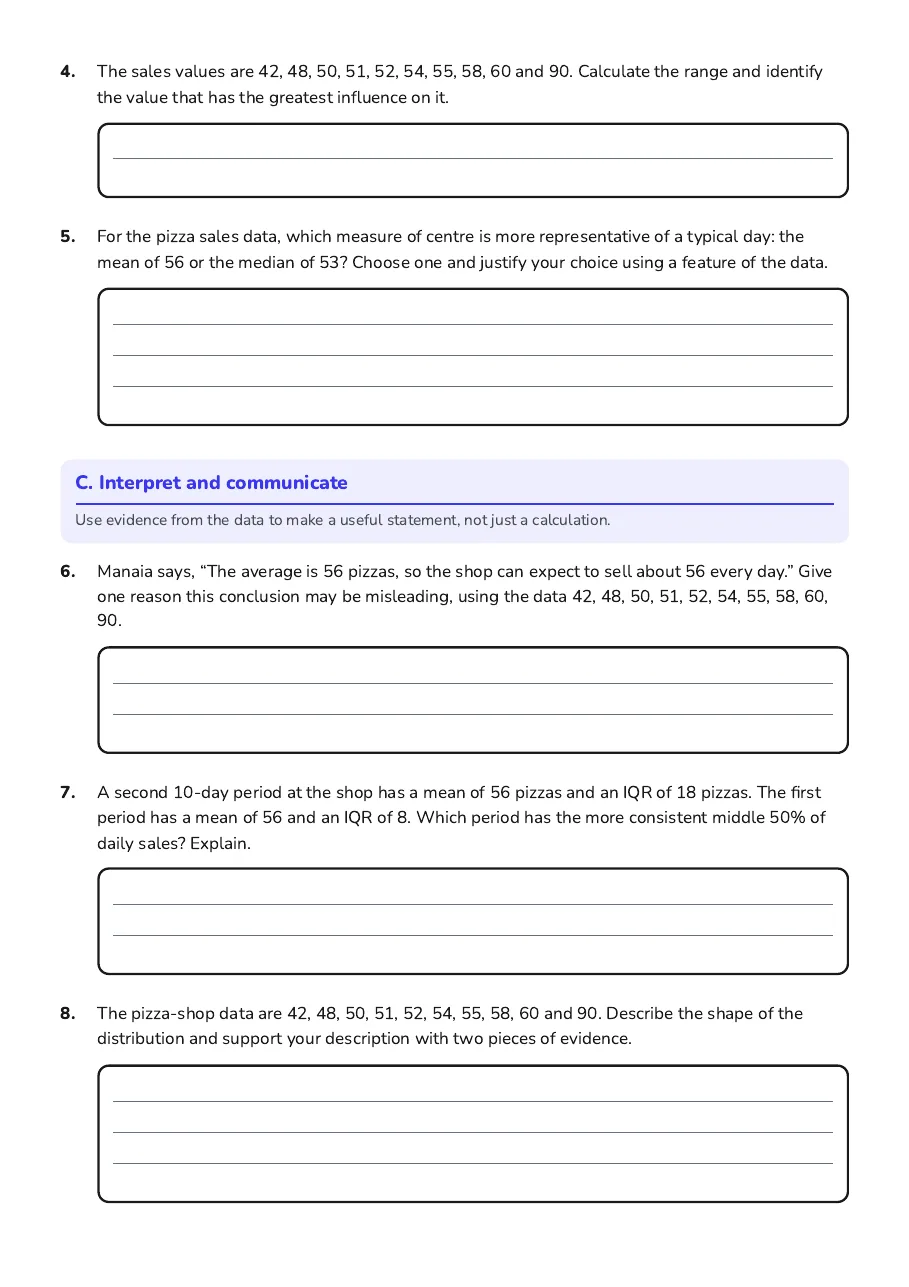
4.The sales values are 42, 48, 50, 51, 52, 54, 55, 58, 60 and 90. Calculate the range and identify the value that has the greatest influence on it.
5.For the pizza sales data, which measure of centre is more representative of a typical day: the mean of 56 or the median of 53? Choose one and justify your choice using a feature of the data.

C. Interpret and communicate

Use evidence from the data to make a useful statement, not just a calculation.

6.Manaia says, “The average is 56 pizzas, so the shop can expect to sell about 56 every day.” Give one reason this conclusion may be misleading, using the data 42, 48, 50, 51, 52, 54, 55, 58, 60, 90.
7.A second 10-day period at the shop has a mean of 56 pizzas and an IQR of 18 pizzas. The first period has a mean of 56 and an IQR of 8. Which period has the more consistent middle 50% of daily sales? Explain.
8.The pizza-shop data are 42, 48, 50, 51, 52, 54, 55, 58, 60 and 90. Describe the shape of the distribution and support your description with two pieces of evidence.
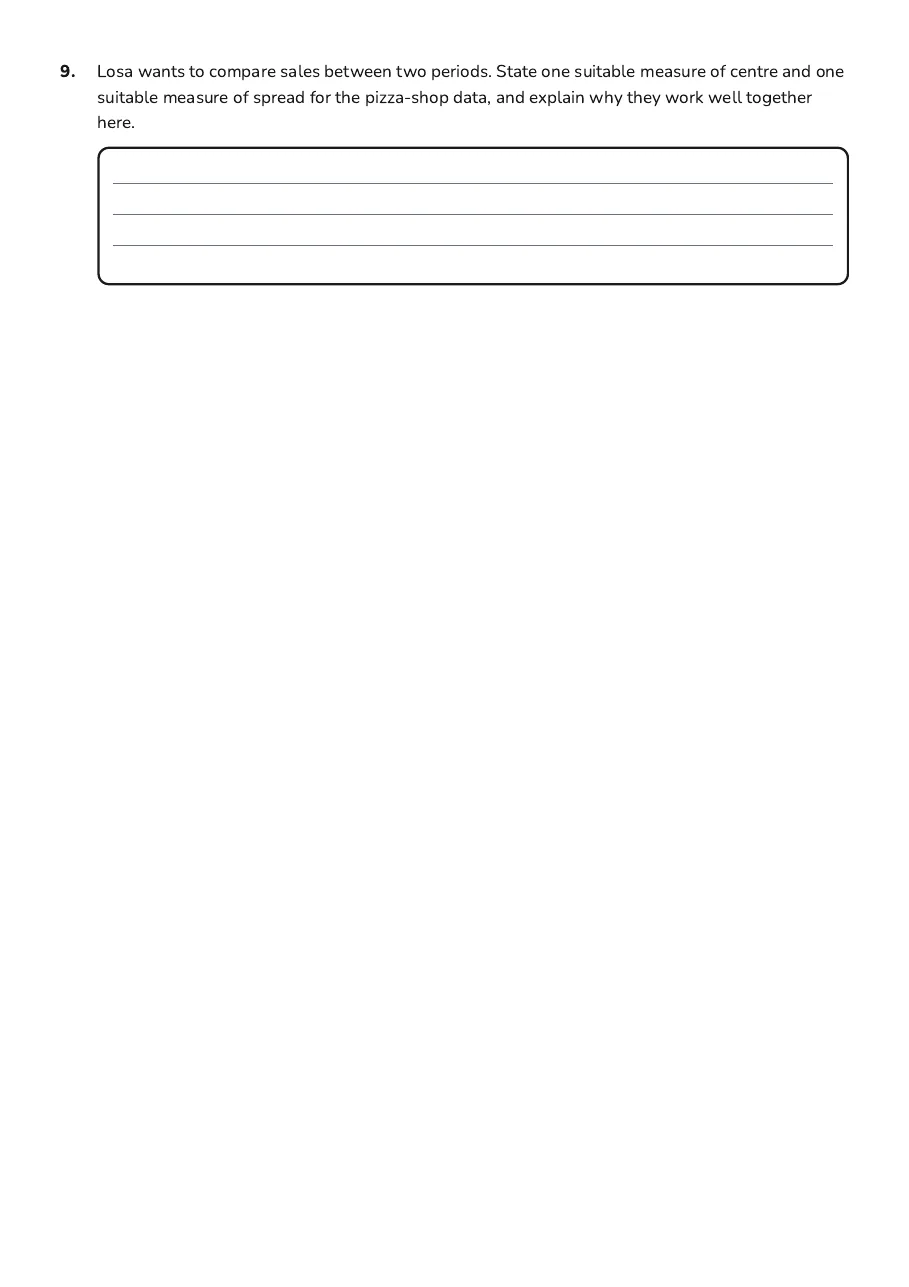
9.Losa wants to compare sales between two periods. State one suitable measure of centre and one suitable measure of spread for the pizza-shop data, and explain why they work well together here.

3 printable pages

  • Data Features Analysis, page 1 of 3: A. The daily data, B. Find the features

    Page 1

  • Data Features Analysis, page 2 of 3: C. Interpret and communicate

    Page 2

  • Data Features Analysis, page 3 of 3: 9. Losa wants to compare sales between two periods. State one suitable measure of centre…

    Page 3

About This Worksheet

Free in Kuraplan

Sign up free, grab the PDF, and customize it for your class.

Print-Ready

Formatted for standard paper. Clean layout, easy to read.

AI-Generated

Created with Kuraplan's AI, designed for real classroom use.

For Teachers & Parents

Use in classrooms, for homework, tutoring, or homeschool.

Need a custom version of this worksheet?

Kuraplan's AI generates custom worksheets in seconds — differentiated for every learner, aligned to your curriculum.

Generate Custom Worksheets — Free
No credit card Curriculum-aligned Under 60 seconds