MathsFreePrintable

Data Inquiry Challenge Worksheet

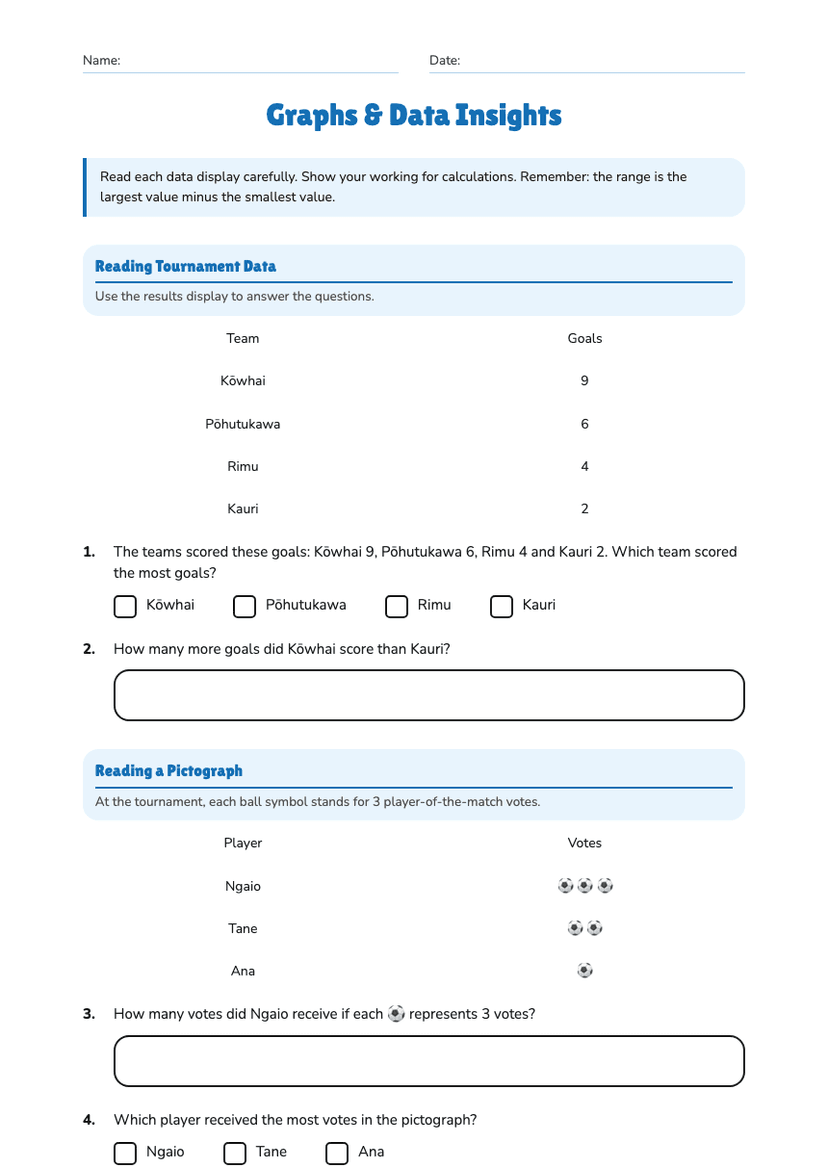
A free maths worksheet ready for your classroom. Open in Kuraplan to grab the print-ready PDF, customize it for your students, or generate a fresh version in seconds.
Data Inquiry Challenge Worksheet worksheet preview
Name:Date:

Data Inquiry Challenge Worksheet

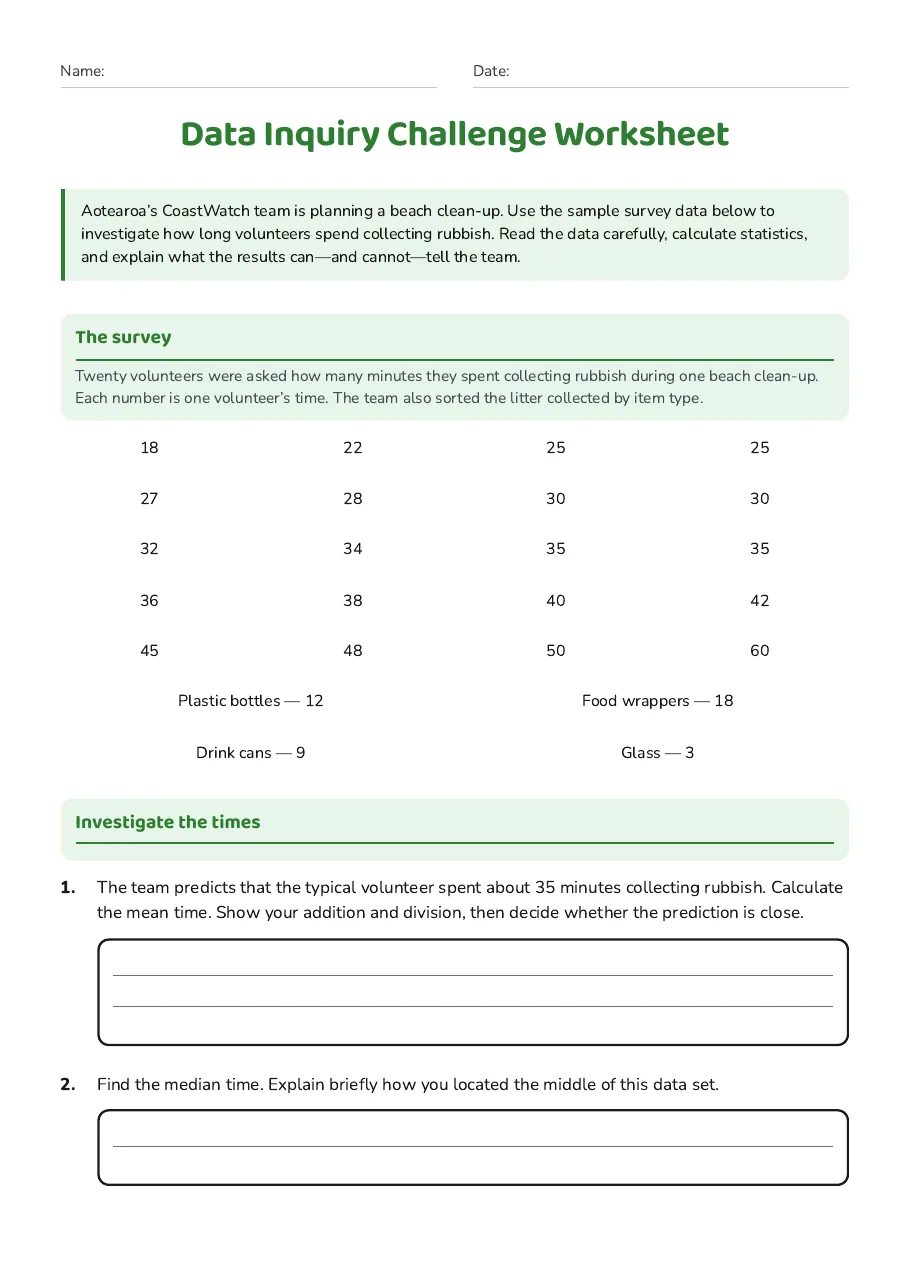
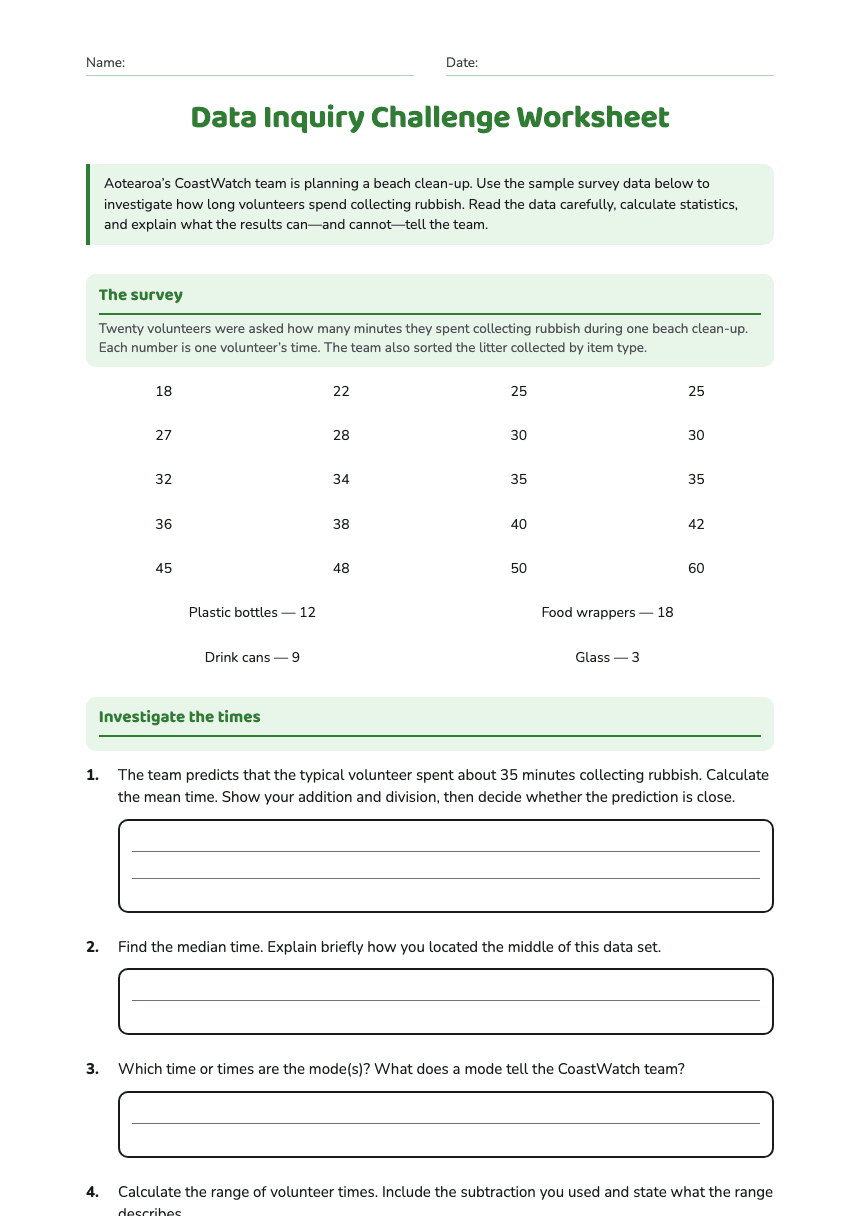
Aotearoa’s CoastWatch team is planning a beach clean-up. Use the sample survey data below to investigate how long volunteers spend collecting rubbish. Read the data carefully, calculate statistics, and explain what the results can—and cannot—tell the team.

The survey

Twenty volunteers were asked how many minutes they spent collecting rubbish during one beach clean-up. Each number is one volunteer’s time. The team also sorted the litter collected by item type.

18

22

25

25

27

28

30

30

32

34

35

35

36

38

40

42

45

48

50

60

Plastic bottles — 12

Food wrappers — 18

Drink cans — 9

Glass — 3

Investigate the times

1.The team predicts that the typical volunteer spent about 35 minutes collecting rubbish. Calculate the mean time. Show your addition and division, then decide whether the prediction is close.
2.Find the median time. Explain briefly how you located the middle of this data set.
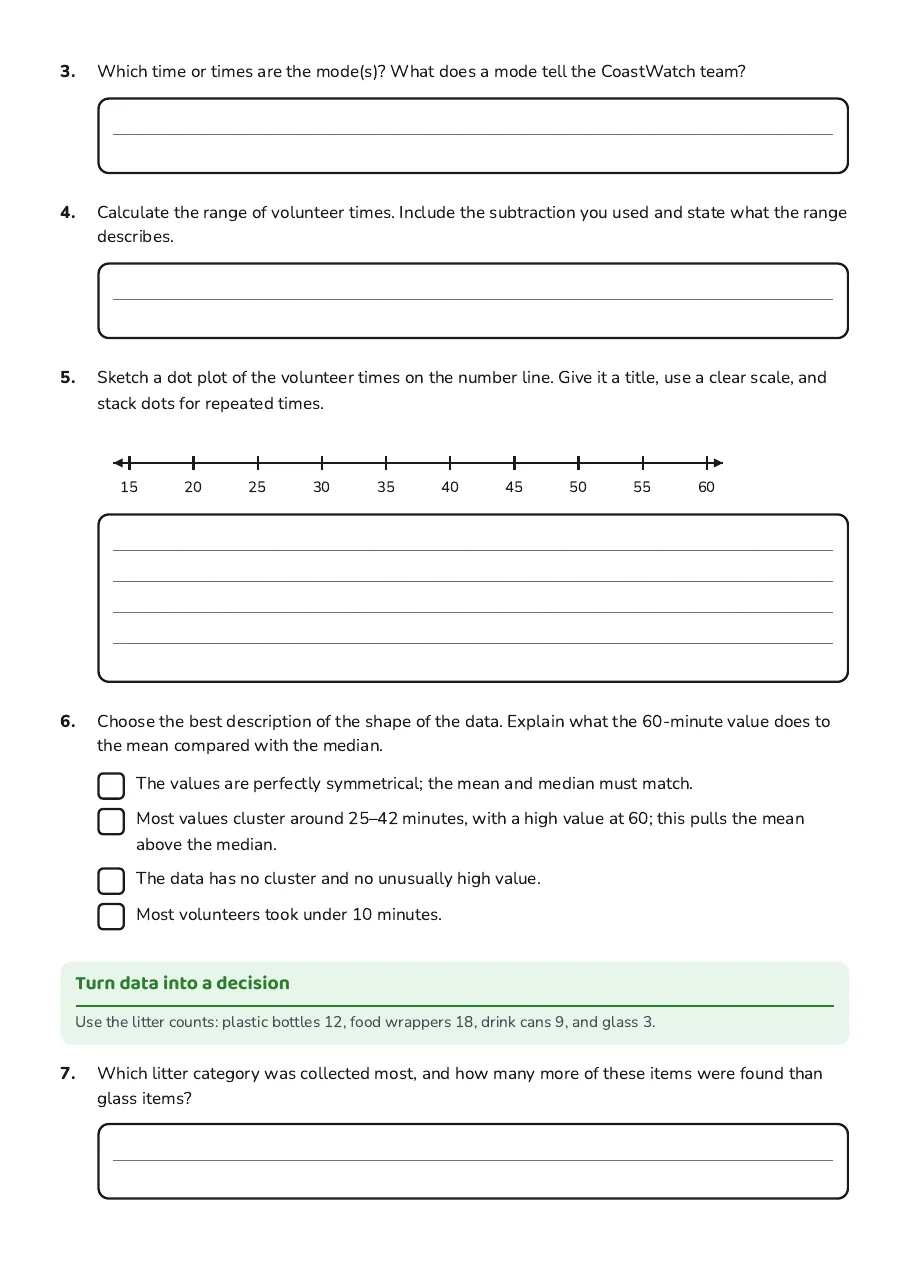
3.Which time or times are the mode(s)? What does a mode tell the CoastWatch team?
4.Calculate the range of volunteer times. Include the subtraction you used and state what the range describes.
5.Sketch a dot plot of the volunteer times on the number line. Give it a title, use a clear scale, and stack dots for repeated times.
15202530354045505560
6.Choose the best description of the shape of the data. Explain what the 60-minute value does to the mean compared with the median.
  • The values are perfectly symmetrical; the mean and median must match.
  • Most values cluster around 25–42 minutes, with a high value at 60; this pulls the mean above the median.
  • The data has no cluster and no unusually high value.
  • Most volunteers took under 10 minutes.

Turn data into a decision

Use the litter counts: plastic bottles 12, food wrappers 18, drink cans 9, and glass 3.

7.Which litter category was collected most, and how many more of these items were found than glass items?
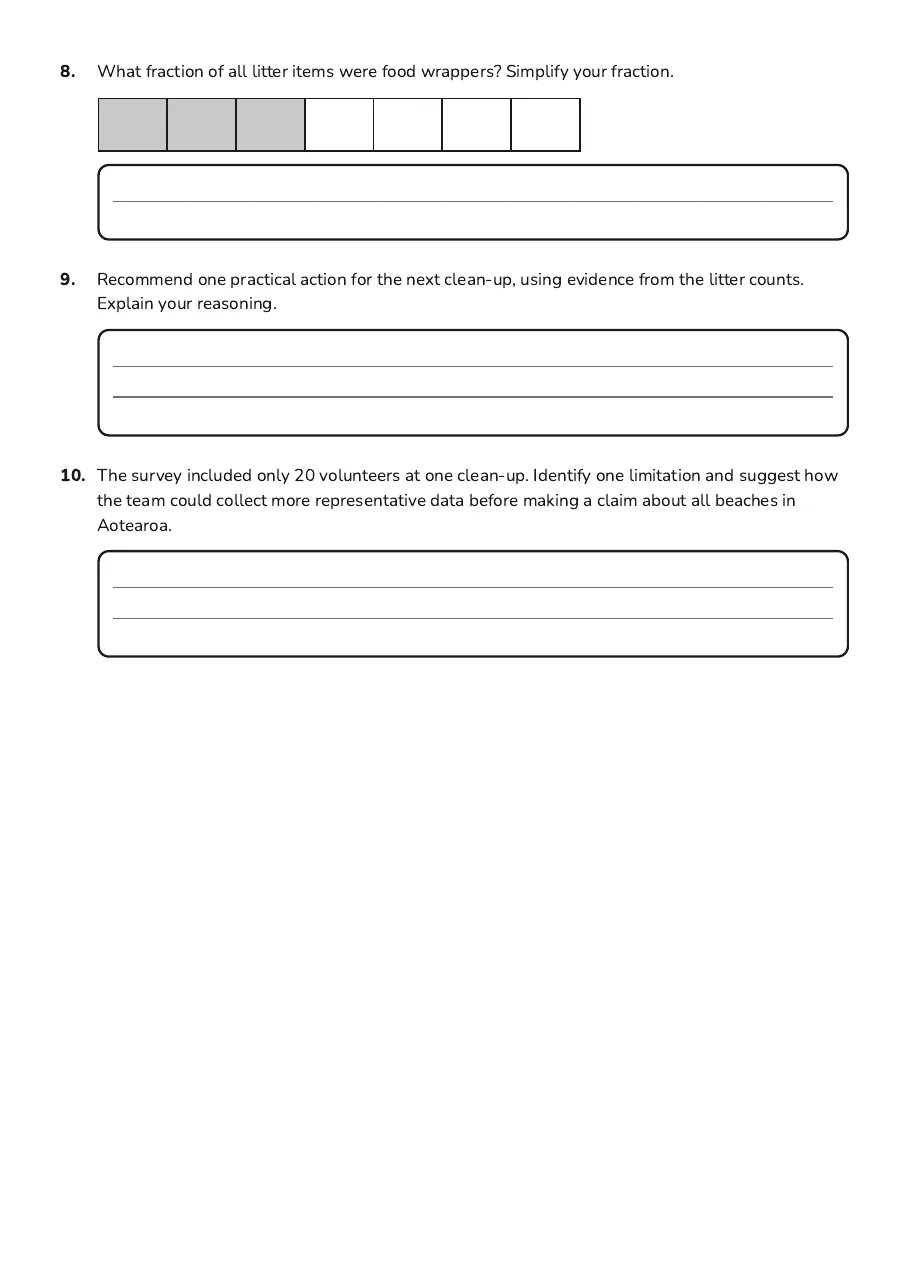
8.What fraction of all litter items were food wrappers? Simplify your fraction.
9.Recommend one practical action for the next clean-up, using evidence from the litter counts. Explain your reasoning.
10.The survey included only 20 volunteers at one clean-up. Identify one limitation and suggest how the team could collect more representative data before making a claim about all beaches in Aotearoa.

3 printable pages

  • Data Inquiry Challenge Worksheet, page 1 of 3: The survey, Investigate the times

    Page 1

  • Data Inquiry Challenge Worksheet, page 2 of 3: Turn data into a decision

    Page 2

  • Data Inquiry Challenge Worksheet, page 3 of 3: The survey

    Page 3

About This Worksheet

Free in Kuraplan

Sign up free, grab the PDF, and customize it for your class.

Print-Ready

Formatted for standard paper. Clean layout, easy to read.

AI-Generated

Created with Kuraplan's AI, designed for real classroom use.

For Teachers & Parents

Use in classrooms, for homework, tutoring, or homeschool.

Need a custom version of this worksheet?

Kuraplan's AI generates custom worksheets in seconds — differentiated for every learner, aligned to your curriculum.

Generate Custom Worksheets — Free
No credit card Curriculum-aligned Under 60 seconds