Data Representation Techniques
A free maths worksheet ready for your classroom. Open in Kuraplan to grab the print-ready PDF, customize it for your students, or generate a fresh version in seconds.
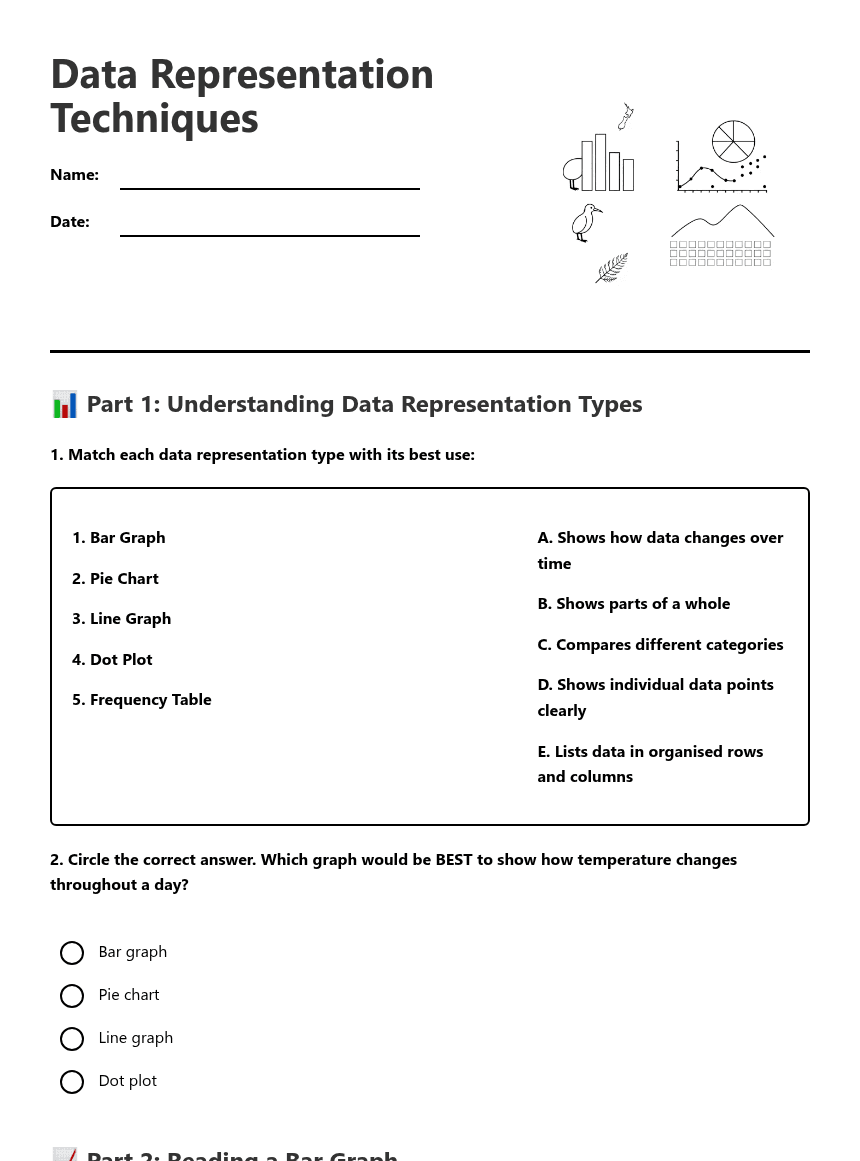
Data Representation Techniques

📊 Part 1: Understanding Data Representation Types
📈 Part 2: Reading a Bar Graph
Example Bar Graph: Favourite Sports in Year 6
This bar graph shows how many students chose each sport as their favourite. The height of each bar shows the number of students.
Imagine a bar graph here showing: Rugby (8 students), Netball (12 students), Soccer (15 students), Swimming (6 students), Cricket (9 students)
a) Which sport was the most popular? ____________________
b) How many students chose swimming? ______ students
c) How many more students chose soccer than rugby? ______ students
d) What is the total number of students surveyed? ______ students
🥧 Part 3: Understanding Pie Charts
Example Pie Chart: How Students Get to School
This pie chart shows the different ways students travel to school. Each slice represents a percentage of all students.
Imagine a pie chart here showing: Walk (40%), Car (30%), Bus (20%), Bike (10%)
a) What percentage of students walk to school? ______%
b) Which method of transport is used by the fewest students? ____________________
c) If there are 100 students in the school, how many come by bus? ______ students
📉 Part 4: Line Graphs and Trends
Example Line Graph: Temperature in Auckland Over One Week
This line graph shows how the temperature changed each day. The line connects the points to show the trend.
Imagine a line graph showing temperatures: Mon (18°C), Tue (20°C), Wed (22°C), Thu (19°C), Fri (17°C), Sat (16°C), Sun (21°C)
a) What was the highest temperature during the week? ______°C
b) On which day was it coldest? ____________________
c) Between which two days did the temperature drop the most? __________ to __________
• Part 5: Dot Plots and Frequency Tables
Example: Number of Pets in Each Family
Frequency Table:
This table shows how many families have each number of pets.
Table showing: 0 pets (3 families), 1 pet (8 families), 2 pets (6 families), 3 pets (2 families), 4 pets (1 family)
Dot Plot:
Each dot represents one family. Dots are stacked above the number of pets.
a) How many families have exactly 2 pets? ______ families
b) What is the most common number of pets? ______ pets
c) How many families were surveyed in total? ______ families
🎯 Part 6: Choosing the Right Representation
a) Showing how many students are in each year level at school:
b) Showing how plant height changes over 4 weeks:
c) Showing what fraction of the school budget goes to different subjects:
a) What data would you collect? ________________________________________________
b) Which type of graph or table would you use? ________________________________
c) Explain why this representation would work best:
🤔 Part 7: Thinking About Data
What questions should you ask about this data to check if it's reliable?
The most important thing I learned about data representation is ________________________________ _________________________________________________ because _________________________________ _____________________________________________________________________________.
About This Worksheet
Free in Kuraplan
Sign up free, grab the PDF, and customize it for your class.
Print-Ready
Formatted for standard paper. Clean layout, easy to read.
AI-Generated
Created with Kuraplan's AI, designed for real classroom use.
For Teachers & Parents
Use in classrooms, for homework, tutoring, or homeschool.
Need a custom version of this worksheet?
Kuraplan's AI generates custom worksheets in seconds — differentiated for every learner, aligned to your curriculum.
Generate Custom Worksheets — Free






