MathsFreePrintable

Data Sorting and Graphs

A free maths worksheet ready for your classroom. Open in Kuraplan to grab the print-ready PDF, customize it for your students, or generate a fresh version in seconds.
Data Sorting and Graphs worksheet preview
Data Sorting and Graphs

Data Sorting and Graphs

Children sorting data and making graphs

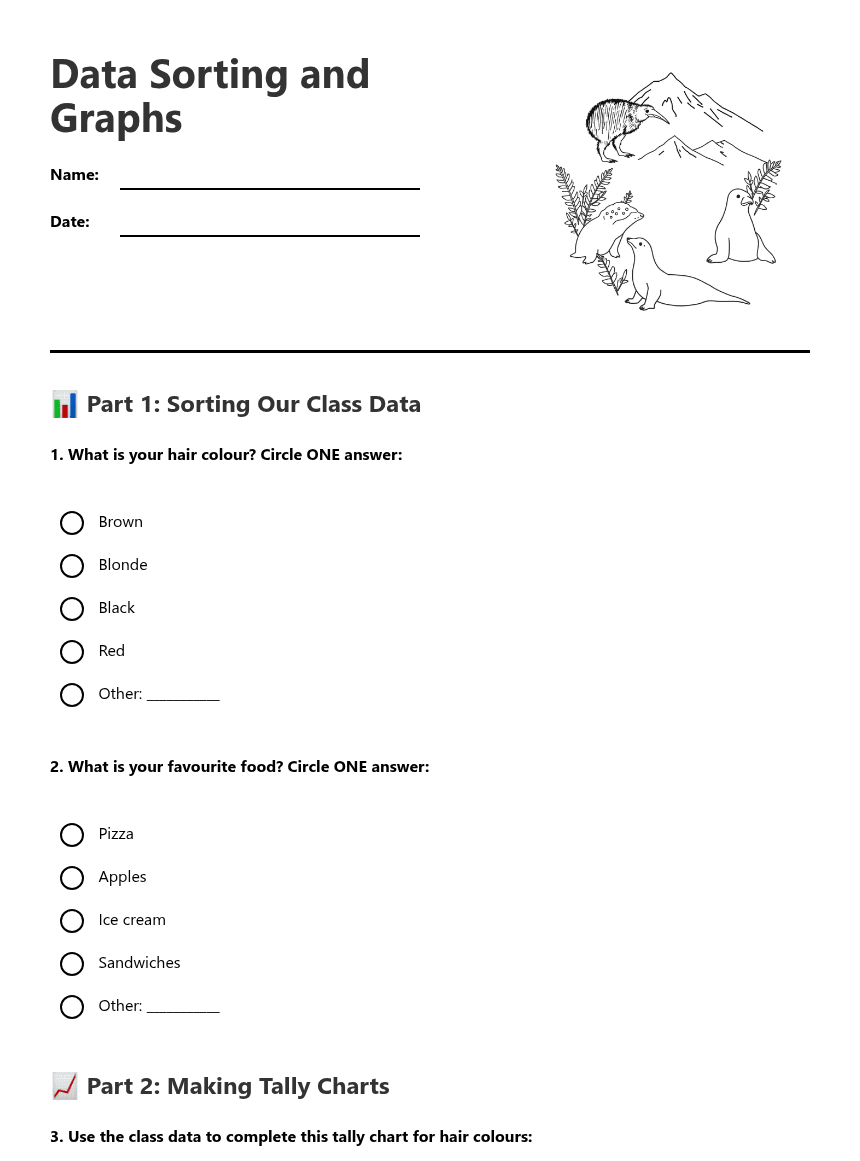
📊 Part 1: Sorting Our Class Data

1. What is your hair colour? Circle ONE answer:

Brown

Blonde

Black

Red

Other: ___________

2. What is your favourite food? Circle ONE answer:

Pizza

Apples

Ice cream

Sandwiches

Other: ___________

📈 Part 2: Making Tally Charts

3. Use the class data to complete this tally chart for hair colours:
Brown hair: ___________
Blonde hair: ___________
Black hair: ___________
Red hair: ___________
4. Use the class data to complete this tally chart for favourite foods:
Pizza: ___________
Apples: ___________
Ice cream: ___________
Sandwiches: ___________

🎨 Part 3: Drawing Picture Graphs

5. Draw a picture graph showing hair colours in your class. Use one face symbol for each student:
6. Draw a picture graph showing favourite foods in your class. Use one symbol for each student:

🔍 Part 4: Describing Our Data

7. Fill in the blanks using your tally charts:

The most common hair colour in our class is ___________.

The least common hair colour in our class is ___________.

The most popular food in our class is ___________.

There are _______ more students with brown hair than blonde hair.

8. Circle the correct words to complete these sentences:

There are more / less / the same students who like pizza than ice cream.

Brown hair is more / less common than red hair in our class.

Apples are the most / least popular food choice.

9. Write two "I notice..." statements about our class data:
I notice ________________________________
_______________________________________
I notice ________________________________
_______________________________________

🤔 Part 5: Thinking About Data

10. Why is it helpful to sort data into groups?
11. Which type of graph do you think shows the data better - tally charts or picture graphs? Explain why:
12. If we asked a different class the same questions, do you think we would get the same results? Why or why not?

About This Worksheet

Free in Kuraplan

Sign up free, grab the PDF, and customize it for your class.

Print-Ready

Formatted for standard paper. Clean layout, easy to read.

AI-Generated

Created with Kuraplan's AI, designed for real classroom use.

For Teachers & Parents

Use in classrooms, for homework, tutoring, or homeschool.

Need a custom version of this worksheet?

Kuraplan's AI generates custom worksheets in seconds — differentiated for every learner, aligned to your curriculum.

Generate Custom Worksheets — Free


No credit card Curriculum-aligned Under 60 seconds





