MathsFreePrintable

Data Survey Self-Assessment

A free maths worksheet ready for your classroom. Open in Kuraplan to grab the print-ready PDF, customize it for your students, or generate a fresh version in seconds.
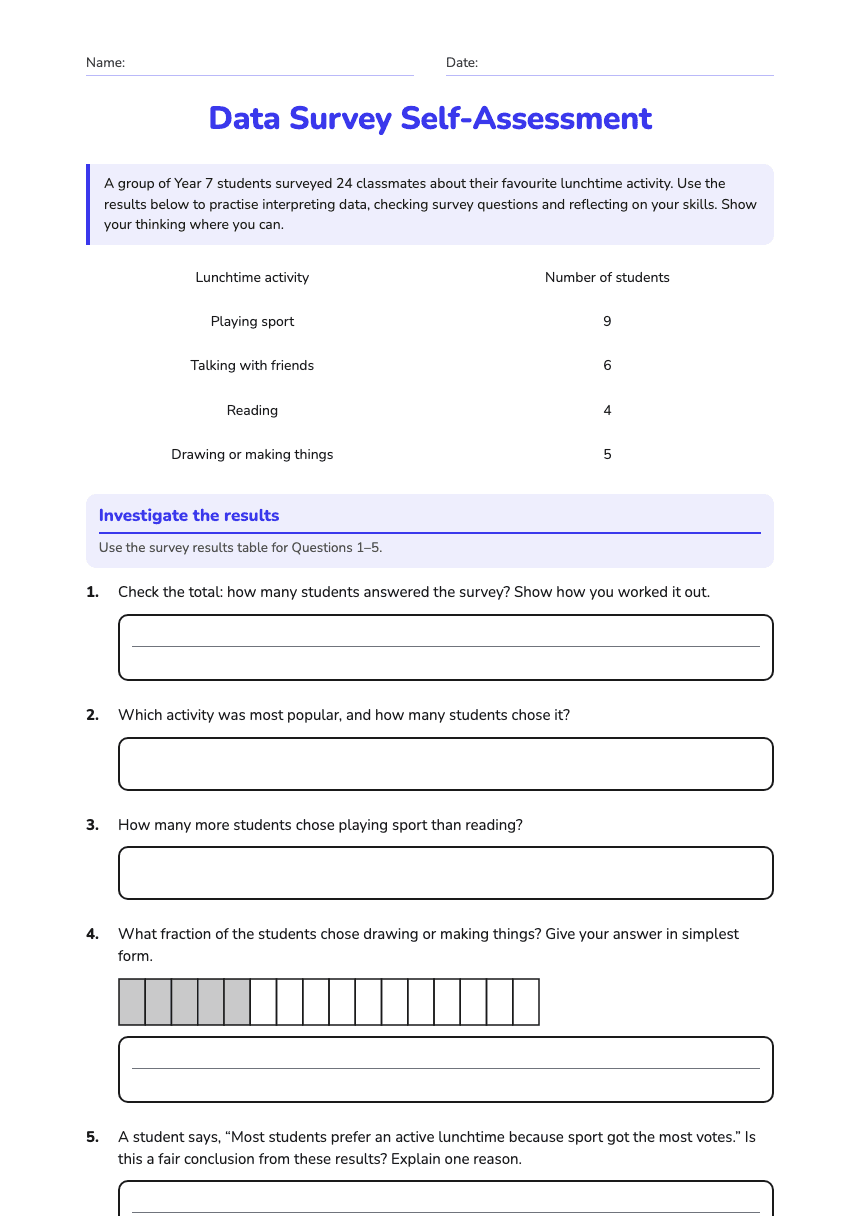
Data Survey Self-Assessment worksheet preview
Name:Date:

Data Survey Self-Assessment

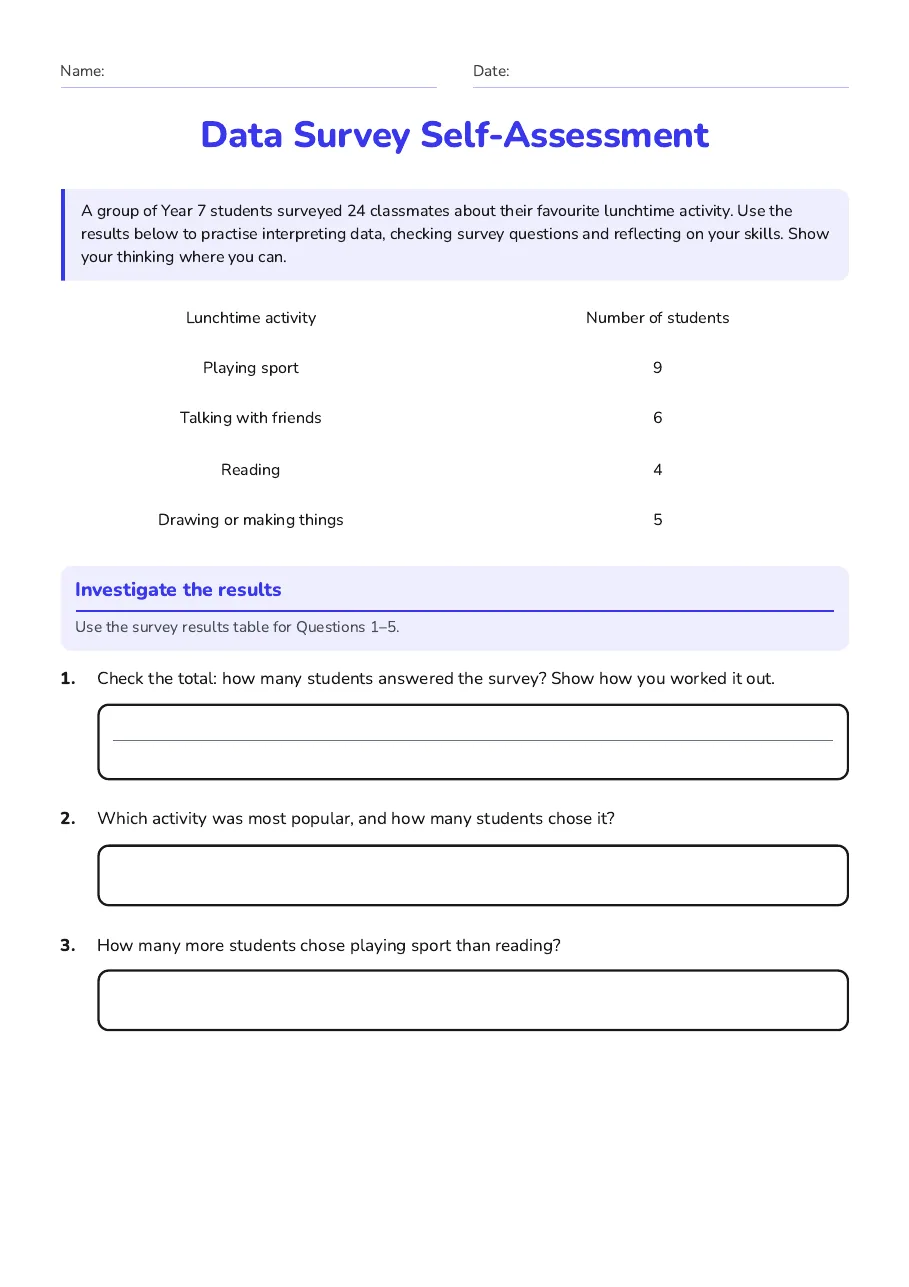
A group of Year 7 students surveyed 24 classmates about their favourite lunchtime activity. Use the results below to practise interpreting data, checking survey questions and reflecting on your skills. Show your thinking where you can.

Lunchtime activity

Number of students

Playing sport

9

Talking with friends

6

Reading

4

Drawing or making things

5

Investigate the results

Use the survey results table for Questions 1–5.

1.Check the total: how many students answered the survey? Show how you worked it out.
2.Which activity was most popular, and how many students chose it?
3.How many more students chose playing sport than reading?
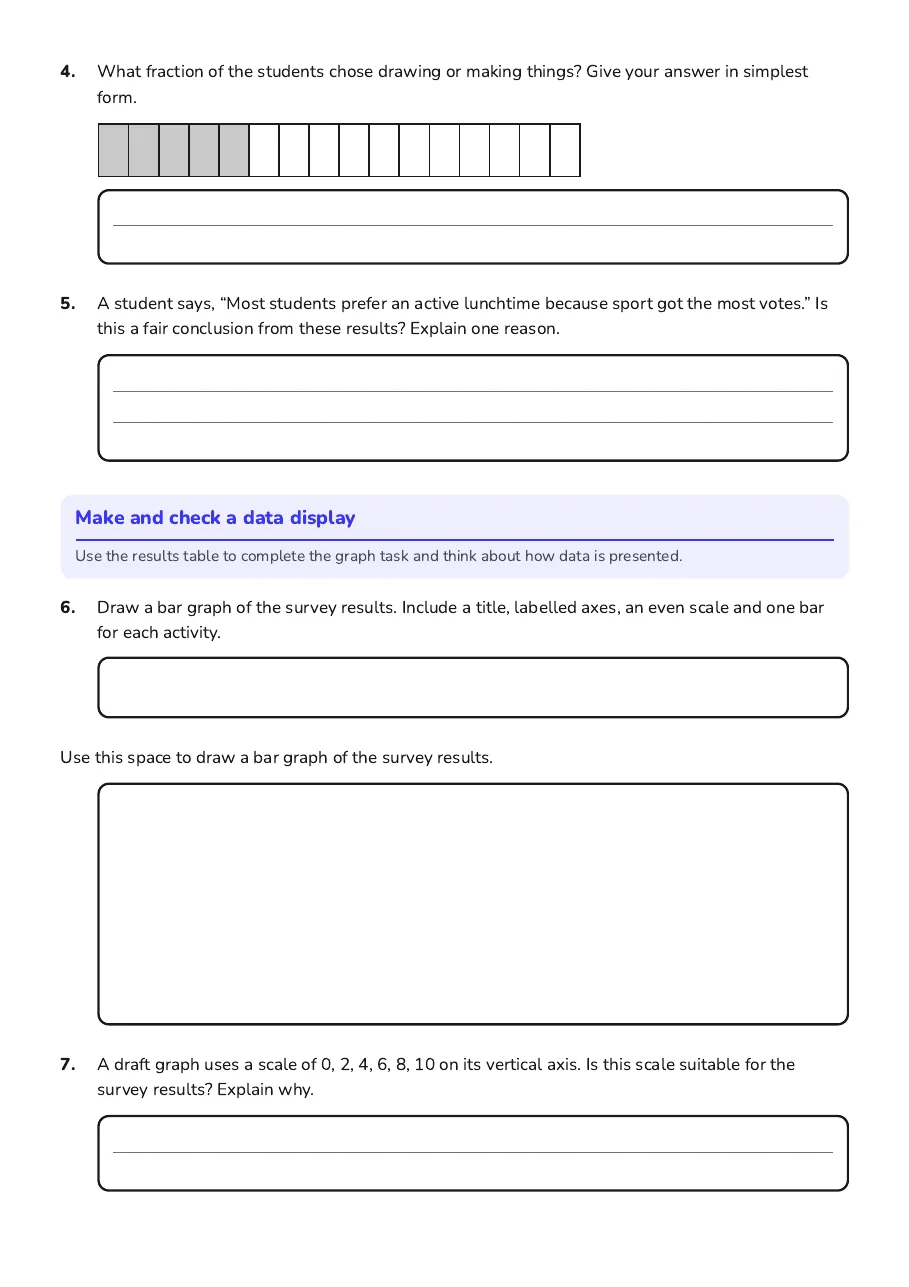
4.What fraction of the students chose drawing or making things? Give your answer in simplest form.
5.A student says, “Most students prefer an active lunchtime because sport got the most votes.” Is this a fair conclusion from these results? Explain one reason.

Make and check a data display

Use the results table to complete the graph task and think about how data is presented.

6.Draw a bar graph of the survey results. Include a title, labelled axes, an even scale and one bar for each activity.
Use this space to draw a bar graph of the survey results.
7.A draft graph uses a scale of 0, 2, 4, 6, 8, 10 on its vertical axis. Is this scale suitable for the survey results? Explain why.

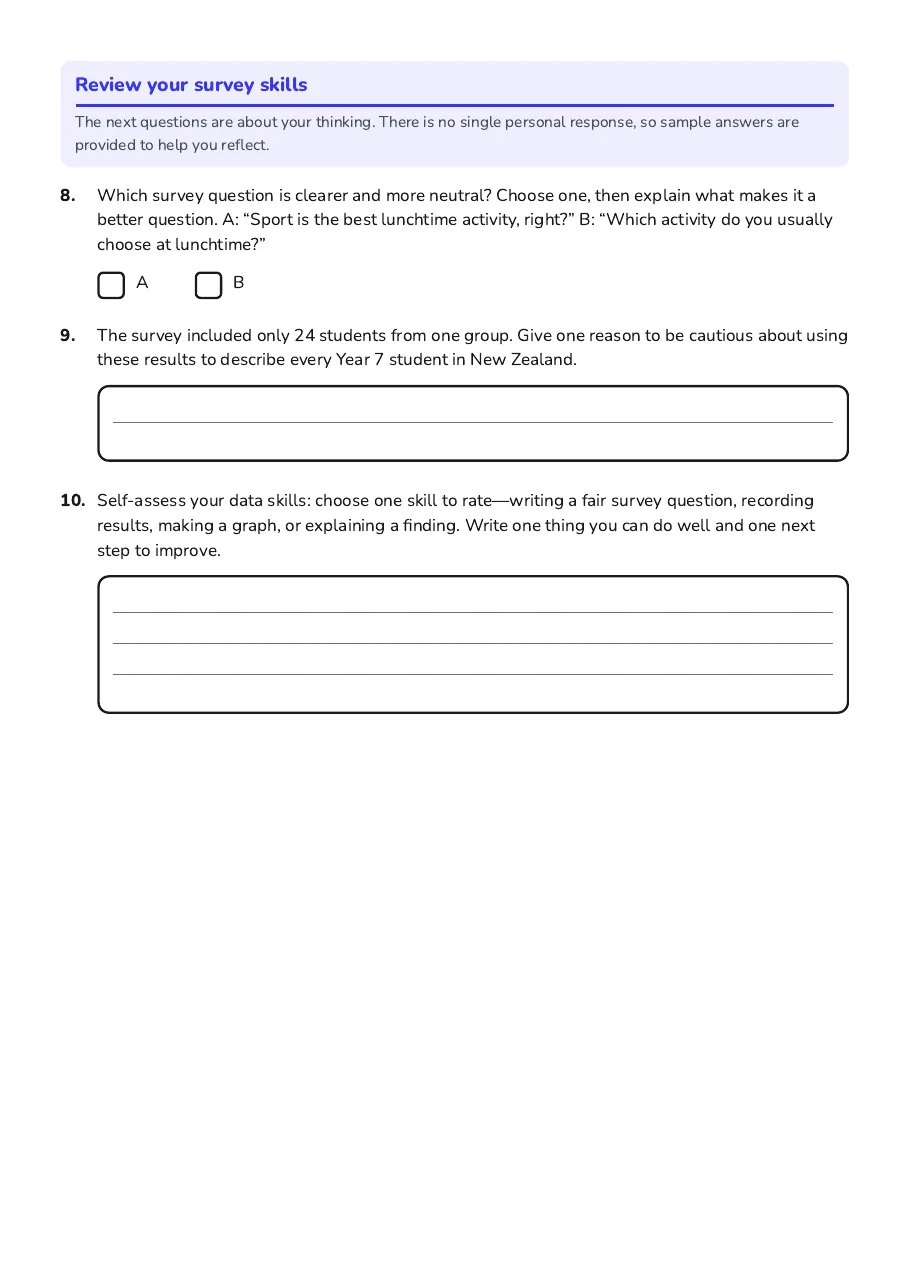
Review your survey skills

The next questions are about your thinking. There is no single personal response, so sample answers are provided to help you reflect.

8.Which survey question is clearer and more neutral? Choose one, then explain what makes it a better question. A: “Sport is the best lunchtime activity, right?” B: “Which activity do you usually choose at lunchtime?”
  • A
  • B
9.The survey included only 24 students from one group. Give one reason to be cautious about using these results to describe every Year 7 student in New Zealand.
10.Self-assess your data skills: choose one skill to rate—writing a fair survey question, recording results, making a graph, or explaining a finding. Write one thing you can do well and one next step to improve.

3 printable pages

  • Data Survey Self-Assessment, page 1 of 3: Investigate the results

    Page 1

  • Data Survey Self-Assessment, page 2 of 3: Make and check a data display

    Page 2

  • Data Survey Self-Assessment, page 3 of 3: Review your survey skills

    Page 3

About This Worksheet

Free in Kuraplan

Sign up free, grab the PDF, and customize it for your class.

Print-Ready

Formatted for standard paper. Clean layout, easy to read.

AI-Generated

Created with Kuraplan's AI, designed for real classroom use.

For Teachers & Parents

Use in classrooms, for homework, tutoring, or homeschool.

Need a custom version of this worksheet?

Kuraplan's AI generates custom worksheets in seconds — differentiated for every learner, aligned to your curriculum.

Generate Custom Worksheets — Free
No credit card Curriculum-aligned Under 60 seconds