Data Variability Measures
A free maths worksheet ready for your classroom. Open in Kuraplan to grab the print-ready PDF, customize it for your students, or generate a fresh version in seconds.
Data Variability Measures

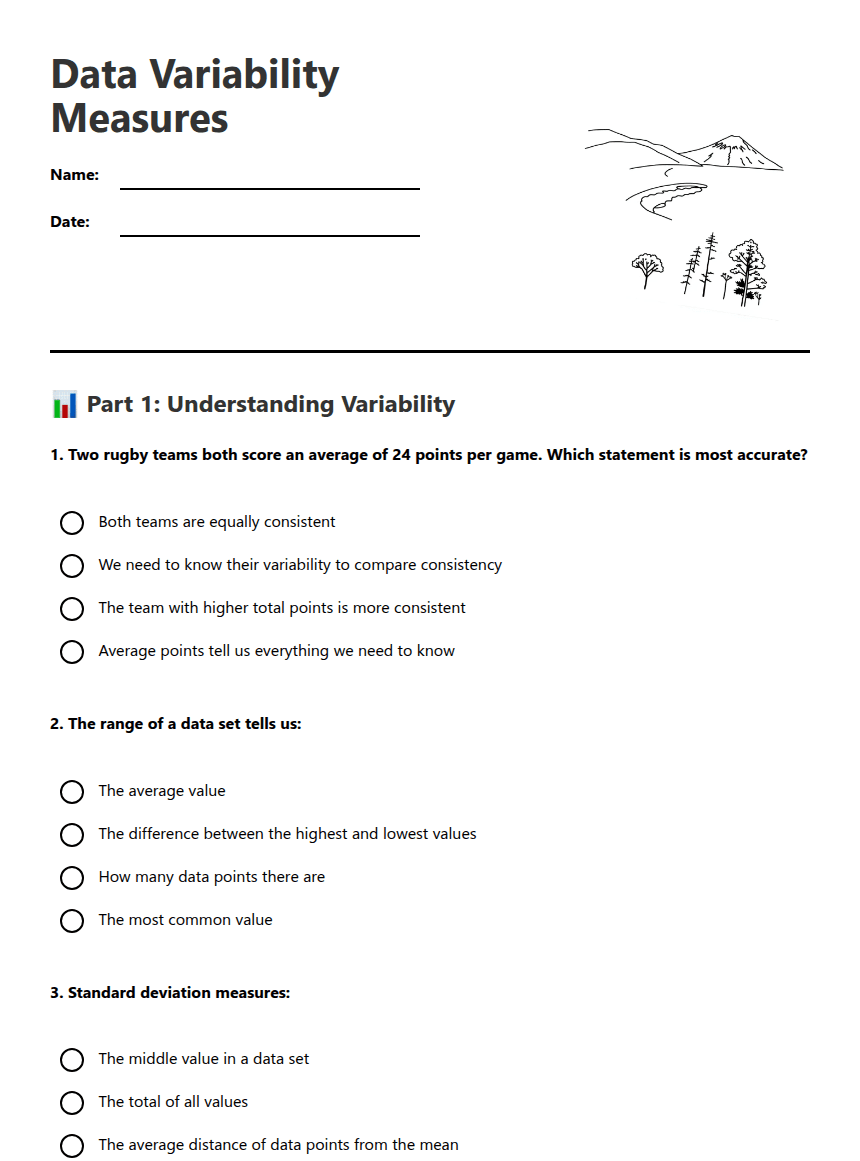
📊 Part 1: Understanding Variability
🔢 Part 2: Calculating Variability Measures
Step 1: Order the data: _________________________________
Step 2: Calculate the range: Highest value - Lowest value = _____ - _____ = _____°C
Step 3: Calculate the mean: Sum ÷ Number of values = _____ ÷ 7 = _____°C
Step 4: Standard deviation = _____ °C (show working above)
Range = _____ pies
Mean = _____ pies
Standard deviation = _____ pies
🎯 Part 3: Interpretation and Application
Player A: 45, 47, 46, 44, 48, 46 (Mean = 46, Standard deviation = 1.4)
Player B: 52, 38, 49, 41, 55, 41 (Mean = 46, Standard deviation = 6.8)
Which player is more consistent? _______________
Explain your reasoning:
January: Range = 25mm, Standard deviation = 8.2mm
February: Range = 45mm, Standard deviation = 15.1mm
Which month had more predictable rainfall? Explain using statistical terminology:
About This Worksheet
Free in Kuraplan
Sign up free, grab the PDF, and customize it for your class.
Print-Ready
Formatted for standard paper. Clean layout, easy to read.
AI-Generated
Created with Kuraplan's AI, designed for real classroom use.
For Teachers & Parents
Use in classrooms, for homework, tutoring, or homeschool.
Need a custom version of this worksheet?
Kuraplan's AI generates custom worksheets in seconds — differentiated for every learner, aligned to your curriculum.
Generate Custom Worksheets — Free






