Data Variability Measures
A free maths worksheet ready for your classroom. Open in Kuraplan to grab the print-ready PDF, customize it for your students, or generate a fresh version in seconds.
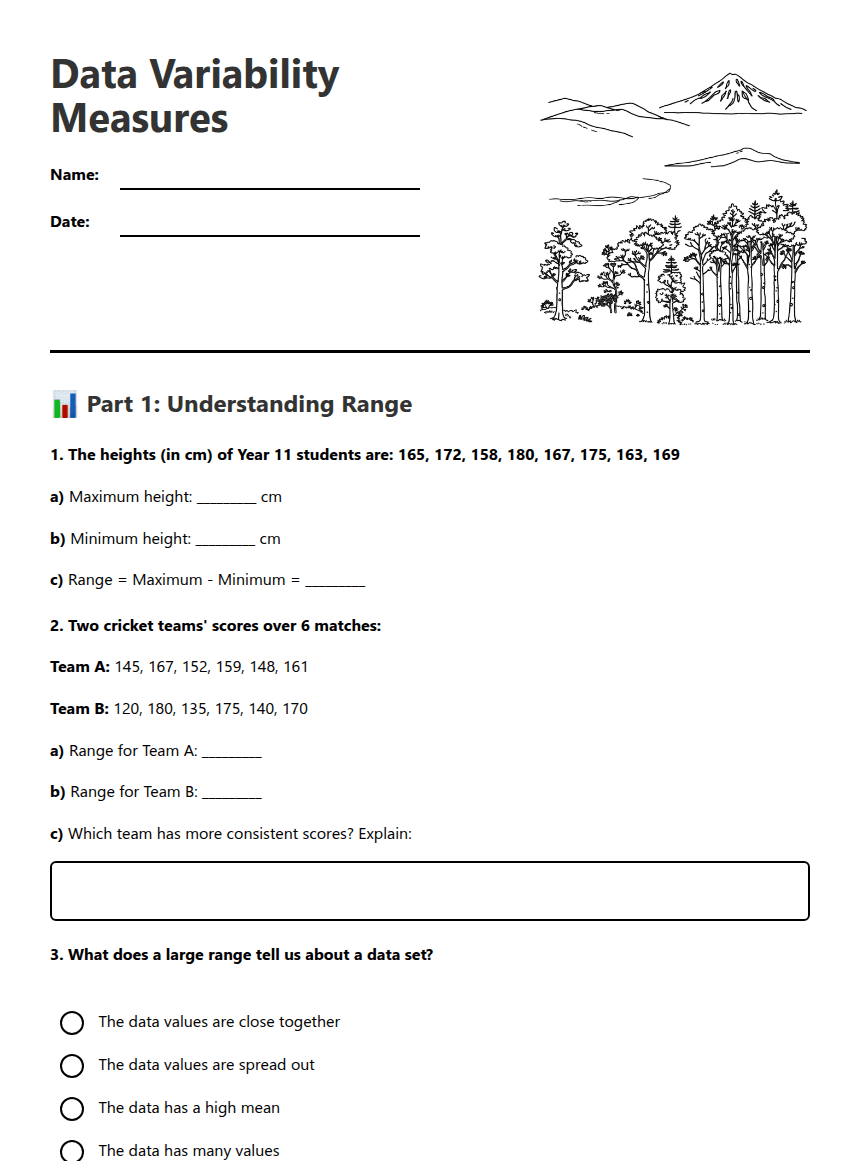
Data Variability Measures

📊 Part 1: Understanding Range
a) Maximum height: _________ cm
b) Minimum height: _________ cm
c) Range = Maximum - Minimum = _________
Team A: 145, 167, 152, 159, 148, 161
Team B: 120, 180, 135, 175, 140, 170
a) Range for Team A: _________
b) Range for Team B: _________
c) Which team has more consistent scores? Explain:
📈 Part 2: Standard Deviation Concepts
Using a calculator or spreadsheet, find:
a) Mean temperature: _________ °C
b) Standard deviation: _________ °C (to 1 decimal place)
City X: Standard deviation = 2.1°C
City Y: Standard deviation = 8.5°C
Which city has more variable weather? _________
Explain your reasoning:
🎯 Part 3: Comparing Variability
Class A: Mean = 75%, Range = 30%, Standard deviation = 8.2%
Class B: Mean = 75%, Range = 18%, Standard deviation = 5.1%
About This Worksheet
Free in Kuraplan
Sign up free, grab the PDF, and customize it for your class.
Print-Ready
Formatted for standard paper. Clean layout, easy to read.
AI-Generated
Created with Kuraplan's AI, designed for real classroom use.
For Teachers & Parents
Use in classrooms, for homework, tutoring, or homeschool.
Need a custom version of this worksheet?
Kuraplan's AI generates custom worksheets in seconds — differentiated for every learner, aligned to your curriculum.
Generate Custom Worksheets — Free






