Environmental Data Analysis
A free maths worksheet ready for your classroom. Open in Kuraplan to grab the print-ready PDF, customize it for your students, or generate a fresh version in seconds.
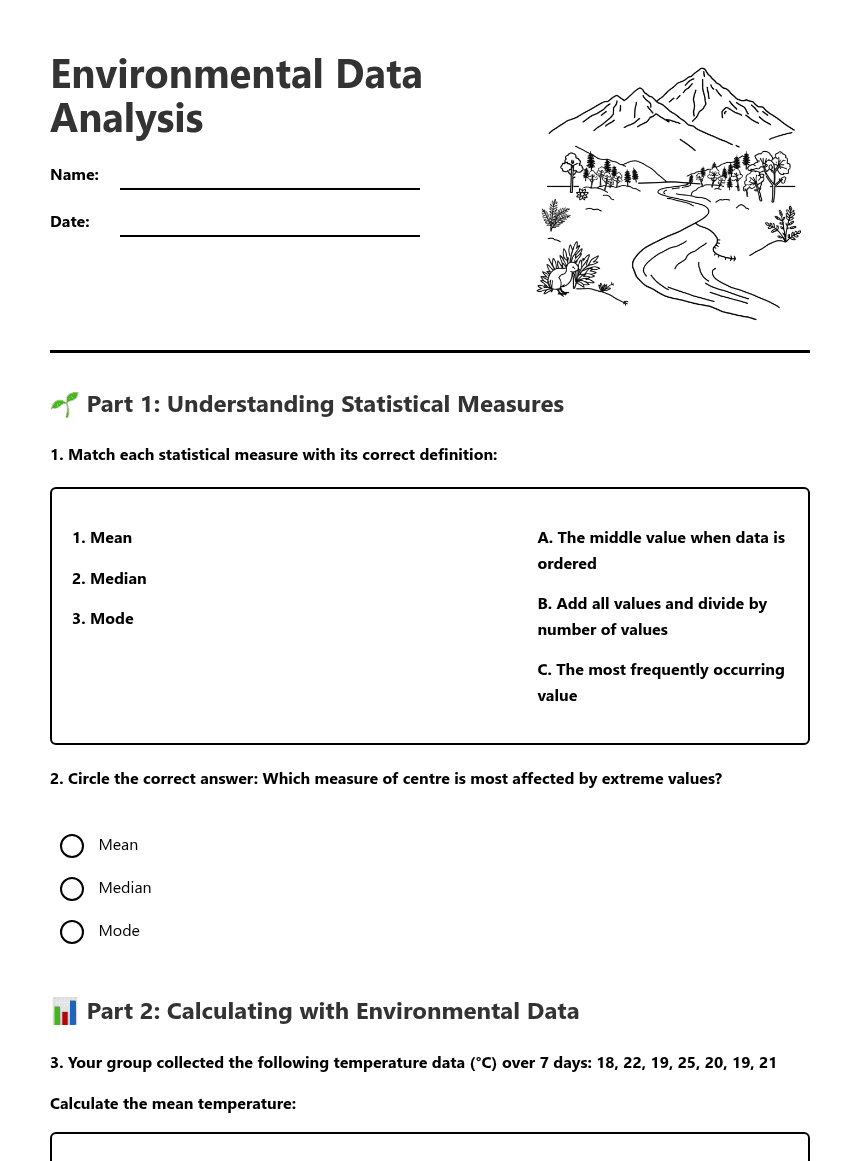
Environmental Data Analysis

🌱 Part 1: Understanding Statistical Measures
📊 Part 2: Calculating with Environmental Data
Calculate the mean temperature:
Find the median temperature:
First, order the data: _____, _____, _____, _____, _____, _____, _____
The median is: ______°C
Identify the mode:
Mean: _________ species
Median: _________ species
Mode: _________ species
📈 Part 3: Data Visualisation
Rubbish items found: Plastic bottles: 12, Paper: 8, Cans: 5, Food wrappers: 15
🌍 Part 4: Environmental Interpretation
When we collected data on plant heights, we found that the _________ height was 45cm, which means this was the most common measurement. The _________ height was 42cm, showing the middle value when all heights were arranged in order. The _________ height was 44cm, calculated by adding all measurements and dividing by the total number of plants.
🔍 Part 5: Data Investigation Planning
Question 1:
Question 2:
Question 3:
Explain your choice:
About This Worksheet
Free in Kuraplan
Sign up free, grab the PDF, and customize it for your class.
Print-Ready
Formatted for standard paper. Clean layout, easy to read.
AI-Generated
Created with Kuraplan's AI, designed for real classroom use.
For Teachers & Parents
Use in classrooms, for homework, tutoring, or homeschool.
Need a custom version of this worksheet?
Kuraplan's AI generates custom worksheets in seconds — differentiated for every learner, aligned to your curriculum.
Generate Custom Worksheets — Free






