MathsFreePrintable

Environmental Data Exploration

A free maths worksheet ready for your classroom. Open in Kuraplan to grab the print-ready PDF, customize it for your students, or generate a fresh version in seconds.

Environmental Data Exploration worksheet preview
Name:Date:

Environmental Data Exploration

A regional river-care group is deciding where to focus its monitoring. The datasets below are simulated for this investigation. Use them to explore patterns, summarise data and consider how strong the evidence is. Give units with numerical answers and show working where appropriate.

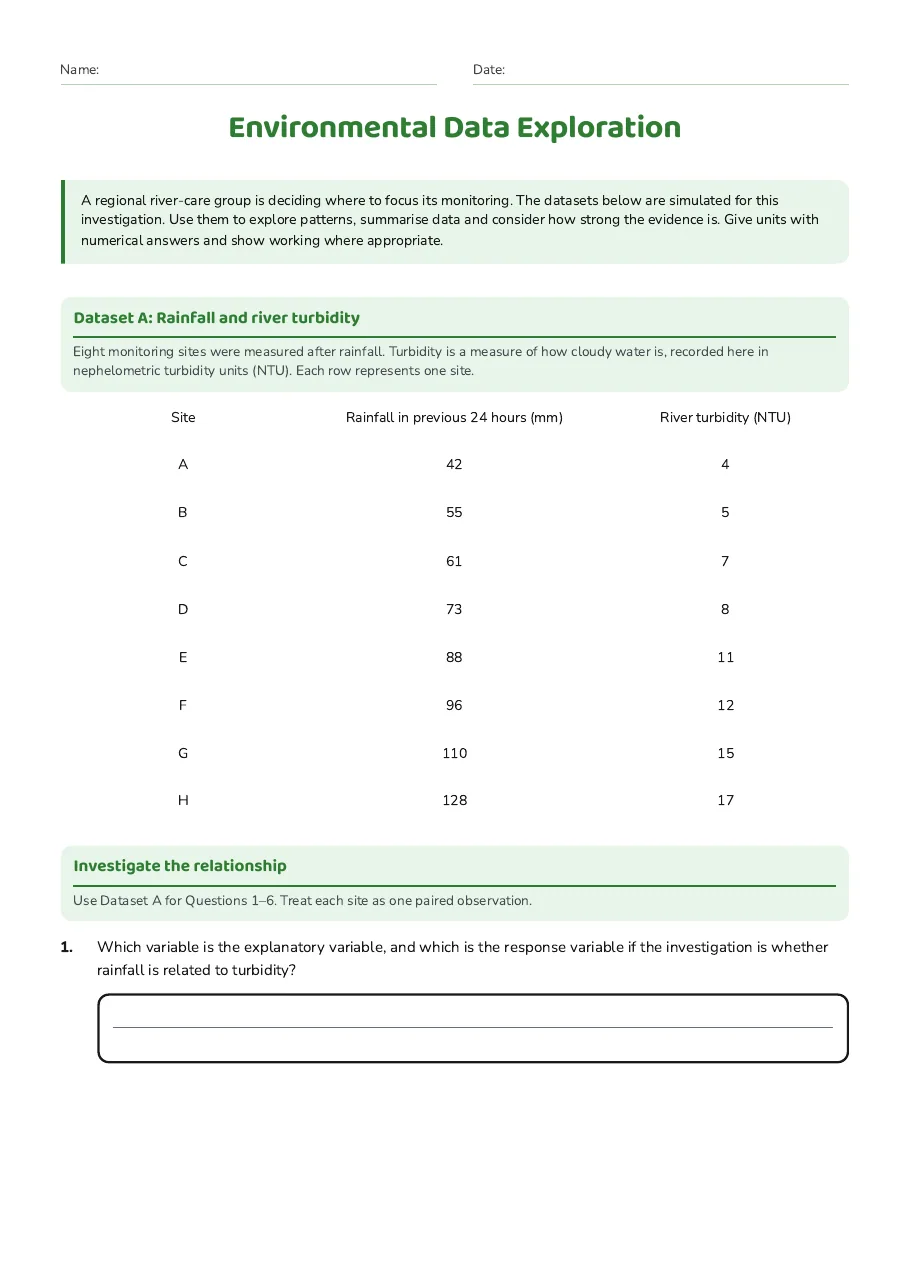
Dataset A: Rainfall and river turbidity

Eight monitoring sites were measured after rainfall. Turbidity is a measure of how cloudy water is, recorded here in nephelometric turbidity units (NTU). Each row represents one site.

Site

Rainfall in previous 24 hours (mm)

River turbidity (NTU)

A

42

4

B

55

5

C

61

7

D

73

8

E

88

11

F

96

12

G

110

15

H

128

17

Investigate the relationship

Use Dataset A for Questions 1–6. Treat each site as one paired observation.

1.Which variable is the explanatory variable, and which is the response variable if the investigation is whether rainfall is related to turbidity?
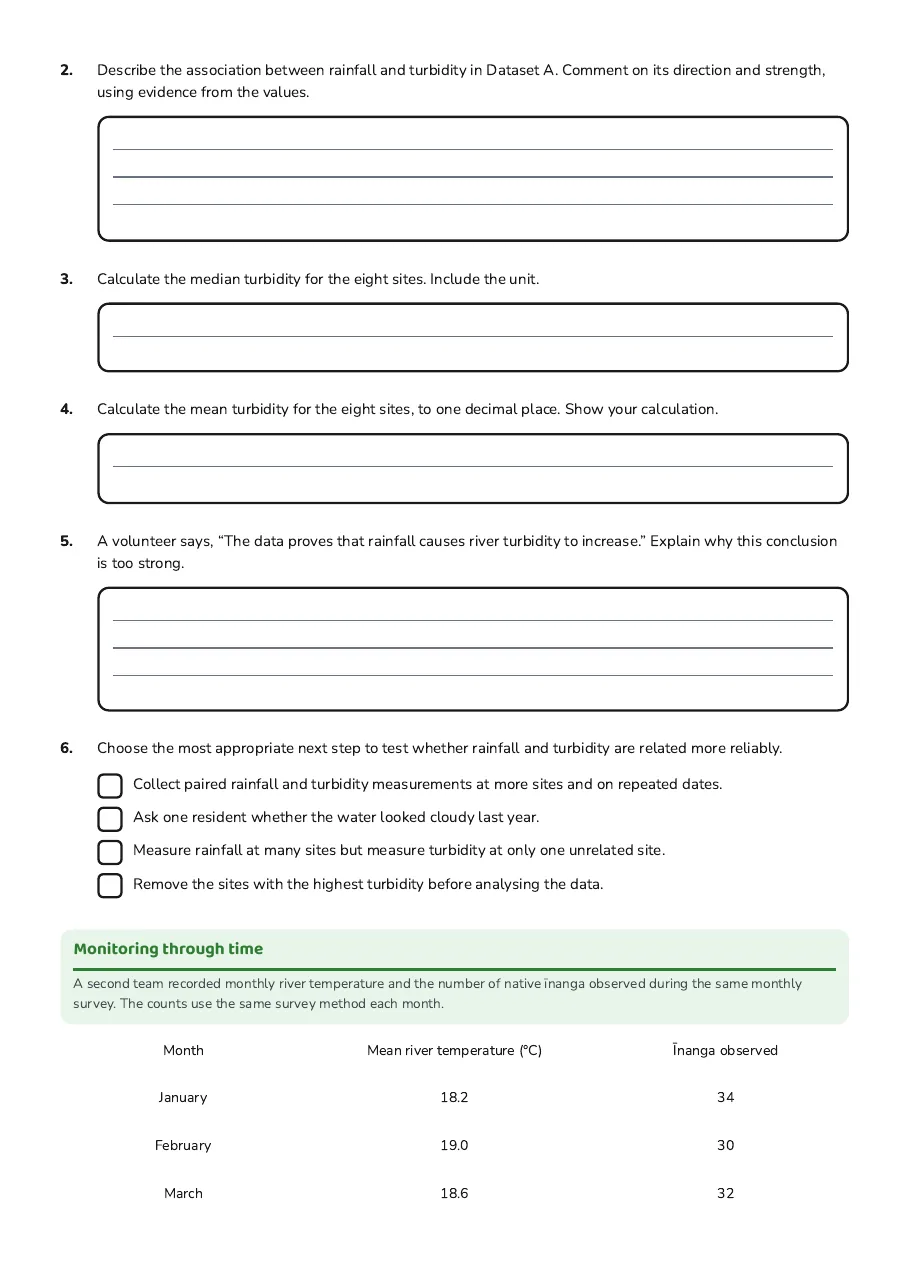
2.Describe the association between rainfall and turbidity in Dataset A. Comment on its direction and strength, using evidence from the values.
3.Calculate the median turbidity for the eight sites. Include the unit.
4.Calculate the mean turbidity for the eight sites, to one decimal place. Show your calculation.
5.A volunteer says, “The data proves that rainfall causes river turbidity to increase.” Explain why this conclusion is too strong.
6.Choose the most appropriate next step to test whether rainfall and turbidity are related more reliably.
  • Collect paired rainfall and turbidity measurements at more sites and on repeated dates.
  • Ask one resident whether the water looked cloudy last year.
  • Measure rainfall at many sites but measure turbidity at only one unrelated site.
  • Remove the sites with the highest turbidity before analysing the data.

Monitoring through time

A second team recorded monthly river temperature and the number of native īnanga observed during the same monthly survey. The counts use the same survey method each month.

Month

Mean river temperature (°C)

Īnanga observed

January

18.2

34

February

19.0

30

March

18.6

32

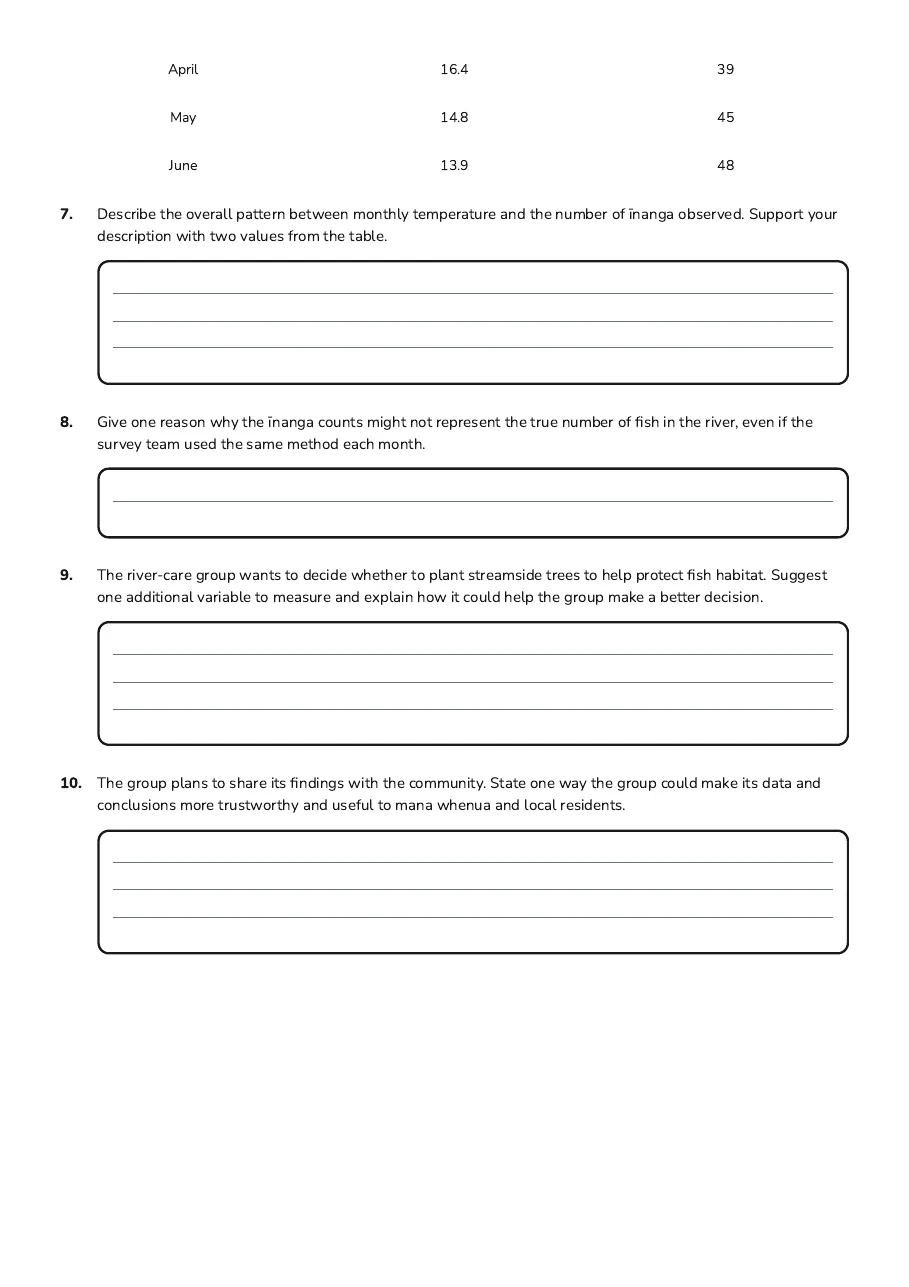
April

16.4

39

May

14.8

45

June

13.9

48

7.Describe the overall pattern between monthly temperature and the number of īnanga observed. Support your description with two values from the table.
8.Give one reason why the īnanga counts might not represent the true number of fish in the river, even if the survey team used the same method each month.
9.The river-care group wants to decide whether to plant streamside trees to help protect fish habitat. Suggest one additional variable to measure and explain how it could help the group make a better decision.
10.The group plans to share its findings with the community. State one way the group could make its data and conclusions more trustworthy and useful to mana whenua and local residents.

3 printable pages

  • Environmental Data Exploration, page 1 of 3: Dataset A: Rainfall and river turbidity, Investigate the relationship

    Page 1

  • Environmental Data Exploration, page 2 of 3: Monitoring through time

    Page 2

  • Environmental Data Exploration, page 3 of 3: April 16.4 39

    Page 3

About This Worksheet

Free in Kuraplan

Sign up free, grab the PDF, and customize it for your class.

Print-Ready

Formatted for standard paper. Clean layout, easy to read.

AI-Generated

Created with Kuraplan's AI, designed for real classroom use.

For Teachers & Parents

Use in classrooms, for homework, tutoring, or homeschool.

Need a custom version of this worksheet?

Kuraplan's AI generates custom worksheets in seconds — differentiated for every learner, aligned to your curriculum.

Generate Custom Worksheets — Free
No credit card Curriculum-aligned Under 60 seconds