MathsFreePrintable

Evaluating Data Reliability

A free maths worksheet ready for your classroom. Open in Kuraplan to grab the print-ready PDF, customize it for your students, or generate a fresh version in seconds.
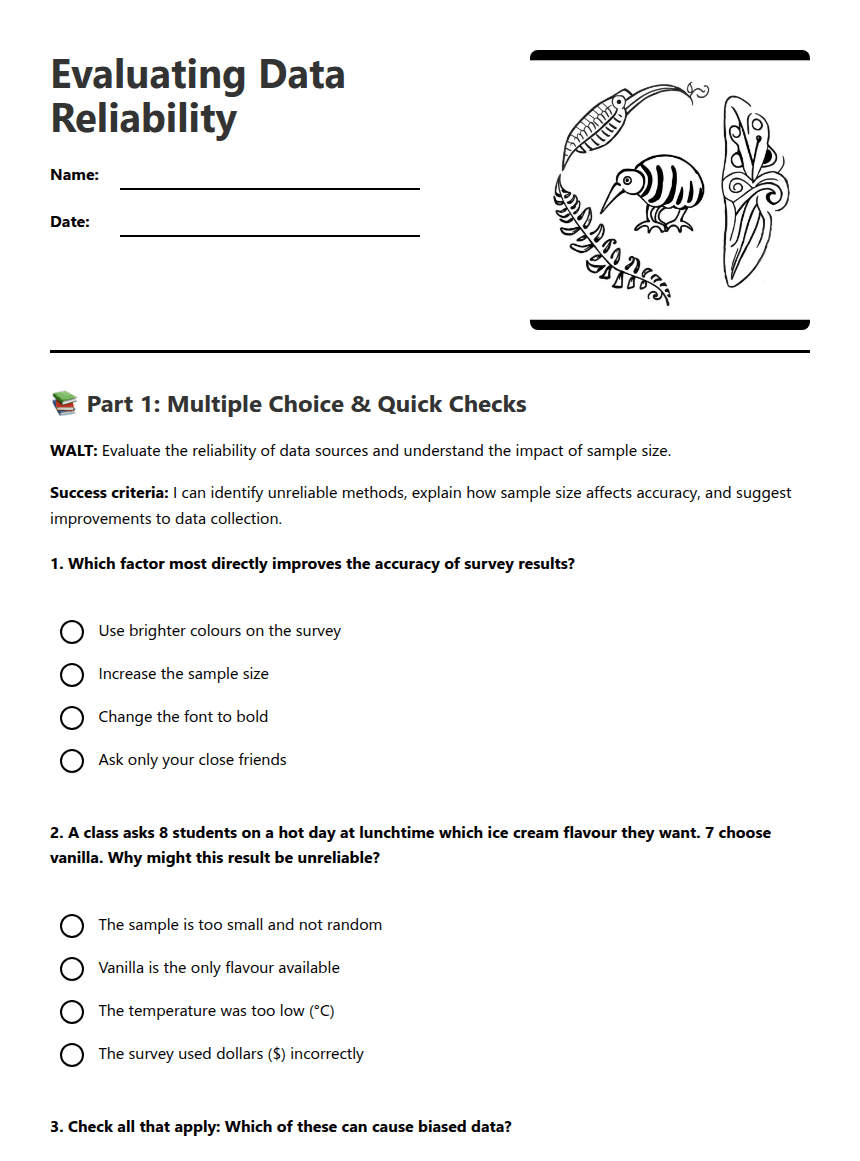
Evaluating Data Reliability worksheet preview

Evaluating Data Reliability

Worksheet illustration

📚 Part 1: Multiple Choice & Quick Checks

WALT: Evaluate the reliability of data sources and understand the impact of sample size.

Success criteria: I can identify unreliable methods, explain how sample size affects accuracy, and suggest improvements to data collection.

1. Which factor most directly improves the accuracy of survey results?

Use brighter colours on the survey

Increase the sample size (Correct: A larger sample size reduces the margin of error and increases the accuracy of results.)

Change the font to bold

Ask only your close friends

2. A class asks 8 students on a hot day at lunchtime which ice cream flavour they want. 7 choose vanilla. Why might this result be unreliable?

The sample is too small and not random (Correct: A small, non-random sample may not represent the preferences of the entire population.)

Vanilla is the only flavour available

The temperature was too low (°C)

The survey used dollars ($) incorrectly

3. Check all that apply: Which of these can cause biased data?

Asking only students who are already club members (Correct: This can lead to a biased sample.)

Using a random sample of the whole school roll

A leading question that suggests an answer (Correct: Leading questions can influence responses.)

Only collecting responses from one lunchtime (Correct: This limits the diversity of responses.)

4. You want a more reliable average weight for Year 7 students. Which change is best?

Measure only students in the sports team

Increase the number of students measured across different classes (Correct: A larger, more diverse sample provides a more accurate average.)

Use centimetres instead of kilograms

Ask students to guess their weight

✏️ Part 2: Short Answers & Practical Thinking

5. Look at this small data summary from a class survey about preferred sport (n = 6): netball 3, rugby 2, swimming 1.
a) Write one sentence explaining why this sample may not represent the whole Year 7.

Suggested Answer: The sample size is too small and may not reflect the diverse preferences of the entire Year 7 population.

b) Suggest two practical improvements to make this survey more reliable. Explain briefly how each improvement would change the conclusions.

Suggested Answers: 1) Increase the sample size to include more students from different classes, which would provide a more accurate representation of preferences. 2) Randomly select students to participate, ensuring that all voices are heard and reducing bias.

6. Teachers sometimes use volunteers for quick surveys. What is a likely problem with volunteer samples? Give one example from school life.

Suggested Answer: Volunteer samples can lead to bias as they may attract only those who are interested in the topic. For example, students who are passionate about sports may volunteer for a survey on sports preferences, skewing the results.

7. Quick calculation: A playground survey of 10 students found 6 prefer playing outdoors. If you survey 100 students using the same method and the proportion stays similar, what effect does the larger sample size have on confidence in the result? Write one sentence.

Suggested Answer: A larger sample size increases confidence in the result as it reduces the margin of error and provides a more reliable estimate of the true preference.

8. Reflective task — In one short paragraph, answer: How can you be a critical consumer of data in everyday life? Mention at least two checks you would make (e.g. who collected the data, sample size, questions asked).

Suggested Answer: To be a critical consumer of data, I would check who collected the data to ensure credibility and examine the sample size to determine if it is large enough to be representative. Additionally, I would consider the wording of questions to identify any potential bias.

Extension (optional): Design one short survey question about favourite after-school activity that avoids bias. Write the question below.

Suggested Answer: "What is your favorite after-school activity? (Options: sports, reading, art, music, other - please specify)"

✅ Answers Section

Refer to the answers provided after each question for detailed explanations and suggested responses.

About This Worksheet

Free in Kuraplan

Sign up free, grab the PDF, and customize it for your class.

Print-Ready

Formatted for standard paper. Clean layout, easy to read.

AI-Generated

Created with Kuraplan's AI, designed for real classroom use.

For Teachers & Parents

Use in classrooms, for homework, tutoring, or homeschool.

Need a custom version of this worksheet?

Kuraplan's AI generates custom worksheets in seconds — differentiated for every learner, aligned to your curriculum.

Generate Custom Worksheets — Free


No credit card Curriculum-aligned Under 60 seconds





