Evaluating Probability and Fairness
A free maths worksheet ready for your classroom. Open in Kuraplan to grab the print-ready PDF, customize it for your students, or generate a fresh version in seconds.
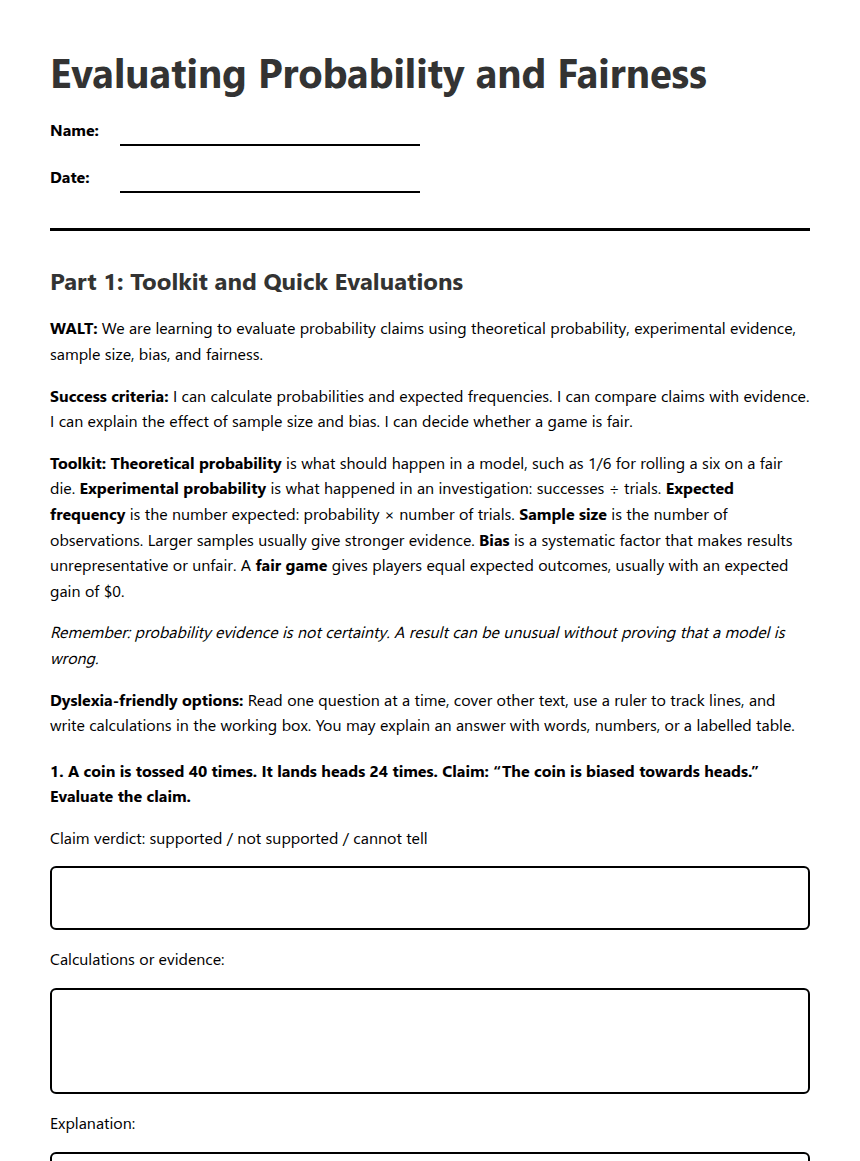
Evaluating Probability and Fairness
Part 1: Toolkit and Quick Evaluations
WALT: We are learning to evaluate probability claims using theoretical probability, experimental evidence, sample size, bias, and fairness.
Success criteria: I can calculate probabilities and expected frequencies. I can compare claims with evidence. I can explain the effect of sample size and bias. I can decide whether a game is fair.
Toolkit: Theoretical probability is what should happen in a model, such as 1/6 for rolling a six on a fair die. Experimental probability is what happened in an investigation: successes ÷ trials. Expected frequency is the number expected: probability × number of trials. Sample size is the number of observations. Larger samples usually give stronger evidence. Bias is a systematic factor that makes results unrepresentative or unfair. A fair game gives players equal expected outcomes, usually with an expected gain of $0.
Remember: probability evidence is not certainty. A result can be unusual without proving that a model is wrong.
Dyslexia-friendly options: Read one question at a time, cover other text, use a ruler to track lines, and write calculations in the working box. You may explain an answer with words, numbers, or a labelled table.
Claim verdict: supported / not supported / cannot tell
Calculations or evidence:
Explanation:
Claim verdict: supported / not supported / cannot tell
Calculations or evidence:
Explanation:
Claim verdict: supported / not supported / cannot tell
Calculations or evidence:
Explanation:
Claim verdict: supported / not supported / cannot tell
Calculations or evidence:
Explanation:
Part 2: Evidence, Bias, and Fair Games
Claim verdict: supported / not supported / cannot tell
Calculations or evidence:
Explanation:
Claim verdict: supported / not supported / cannot tell
Calculations or evidence:
Explanation and possible bias:
Claim verdict: supported / not supported / cannot tell
Calculations or evidence:
Explanation:
Claim verdict: supported / not supported / cannot tell
Calculations or evidence:
Explanation:
Challenge
Why is your game fair?
Answer Guide
1. Cannot tell. Experimental probability of heads is 24 ÷ 40 = 0.60. This suggests more heads than the theoretical 0.50, but 40 tosses is not enough to prove the coin is biased. More trials would give stronger evidence.
2. Supported, but not proven. The expected number of sixes is 120 × 1/6 = 20. The result of 18 is close to 20. It is reasonable evidence for a fair die, but one experiment cannot prove fairness.
3. Not supported. An equal four-colour spinner has theoretical probability 1/4 = 0.25 for blue. The experimental probability is 20 ÷ 50 = 0.40. The result may be due to chance, but it does not support a claim that the theoretical probability is 0.40.
4. Each ticket has probability 3/200 if you own 3 tickets. Expected prize money is 500 × 3/200 = $7.50. You pay 3 × $1 = $3, so your expected gain is $4.50, assuming the ticket price is $1. Equal chance per ticket does not automatically make the raffle financially fair.
5. Not supported. There is a 1/2 chance of an even result and a 1/2 chance of an odd result. Expected gain is (1/2 × $2) + (1/2 × −$1) = $1 − $0.50 = $0.50. The player gains $0.50 on average, so the game is not fair if fair means expected gain of $0.
6. Cannot tell. The sample proportion is 14 ÷ 18, about 0.78, but the sample is small. Lunchtime students may not represent the whole school. This is possible selection or time-of-day bias. A larger random sample from all year levels would improve the investigation.
7. Not supported. For an independent fair coin, the probability of heads on the next toss remains 1/2. The previous result does not change the next result.
8. Not supported. A 70% chance means rain is expected on about 70 out of 100 similar days, not that rain is certain tomorrow. Probability describes likelihood, not certainty.
9. Answers may vary. For example, use probabilities 1/2 for $0, 1/4 for $2, and 1/4 for $4. Expected prize = (1/2 × $0) + (1/4 × $2) + (1/4 × $4) = $1.50. If the entry fee is $1.50, expected gain is $0, so the game is fair.
10. A strong answer surveys a larger random sample from students across all year levels and different times or days. The question should be neutral, such as “Should buses run later?” Avoid surveying only students who are waiting for buses.
11. Fairness concerns equal chances or equal expected outcomes over time. Equal outcomes do not have to occur in every short run. For example, a fair coin game may produce five heads in six tosses. The individual result is uneven, but the chances remain equal.
About This Worksheet
Free in Kuraplan
Sign up free, grab the PDF, and customize it for your class.
Print-Ready
Formatted for standard paper. Clean layout, easy to read.
AI-Generated
Created with Kuraplan's AI, designed for real classroom use.
For Teachers & Parents
Use in classrooms, for homework, tutoring, or homeschool.
Need a custom version of this worksheet?
Kuraplan's AI generates custom worksheets in seconds — differentiated for every learner, aligned to your curriculum.
Generate Custom Worksheets — Free