MathsFreePrintable

Exploring Averages with Graphs

A free maths worksheet ready for your classroom. Open in Kuraplan to grab the print-ready PDF, customize it for your students, or generate a fresh version in seconds.
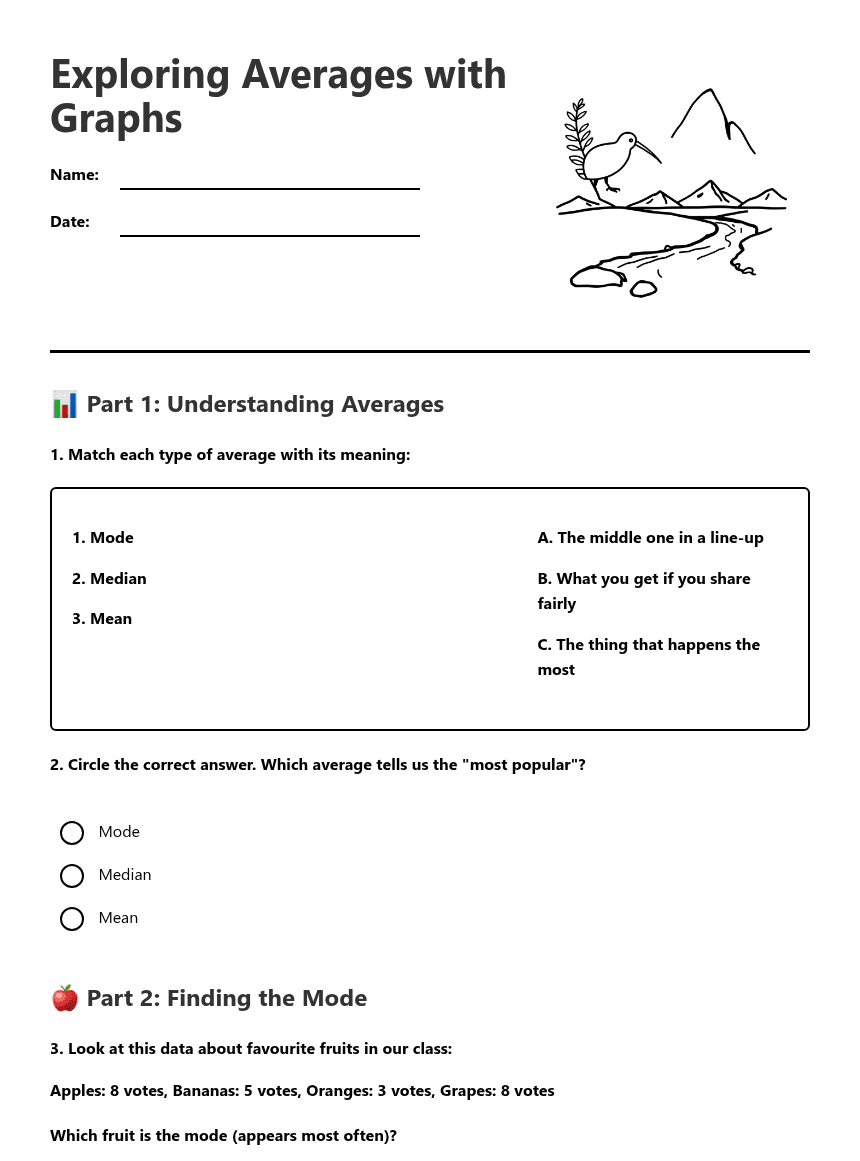
Exploring Averages with Graphs worksheet preview

Exploring Averages with Graphs

Exploring Averages with Graphs

Bar graph with colourful data bars

📊 Part 1: Understanding Averages

1. Match each type of average with its meaning:
1. Mode
2. Median
3. Mean
A. The middle one in a line-up
B. What you get if you share fairly
C. The thing that happens the most
2. Circle the correct answer. Which average tells us the "most popular"?

Mode

Median

Mean

🍎 Part 2: Finding the Mode

3. Look at this data about favourite fruits in our class:

Apples: 8 votes, Bananas: 5 votes, Oranges: 3 votes, Grapes: 8 votes

Which fruit is the mode (appears most often)?

Apples only

Grapes only

Both apples and grapes

Bananas

4. Draw a simple bar graph to show the fruit data above:

📏 Part 3: Finding the Median

5. Here are the heights of 5 students in centimetres: 120, 115, 125, 118, 122

First, put them in order from smallest to biggest: _____, _____, _____, _____, _____

The median (middle number) is: _____ cm

6. Circle the correct answer. To find the median, we need to:

Find the biggest number

Put numbers in order and find the middle

Add all numbers together

Count how many times each number appears

🎈 Part 4: Understanding Mean (Fair Share)

7. There are 15 balloons to share equally among 3 children. How many balloons does each child get?
8. Show your working for the balloon problem:
9. Check all the situations where we might use the mean (fair share):

Sharing lollies equally among friends

Finding the most popular colour

Dividing pocket money fairly

Sharing art supplies in groups

🏫 Part 5: Real-World Averages

10. Our class collected data about pets. Here are the results:

Dogs: 6, Cats: 4, Fish: 2, Birds: 1, Rabbits: 2

The mode (most common pet) is: ________________

If we put the numbers in order: _____, _____, _____, _____, _____

The median is: _____

11. Explain in your own words what the mode tells us about our class pets:
12. Draw a picture showing how you would share 12 stickers equally among 4 friends:

🤔 Part 6: Thinking About Averages

13. Which average would be most useful in these situations? Write Mode, Median, or Mean:

Finding the most popular school lunch: ________________

Sharing 20 pencils among 5 groups: ________________

Finding the middle score in a test: ________________

14. Create your own simple data set and find the mode:

My data (choose something like favourite colours, sports, or animals):

The mode is: ________________

15. What was the most interesting thing you learned about averages today?

About This Worksheet

Free in Kuraplan

Sign up free, grab the PDF, and customize it for your class.

Print-Ready

Formatted for standard paper. Clean layout, easy to read.

AI-Generated

Created with Kuraplan's AI, designed for real classroom use.

For Teachers & Parents

Use in classrooms, for homework, tutoring, or homeschool.

Need a custom version of this worksheet?

Kuraplan's AI generates custom worksheets in seconds — differentiated for every learner, aligned to your curriculum.

Generate Custom Worksheets — Free


No credit card Curriculum-aligned Under 60 seconds





