Interpreting Statistical Information
A free maths worksheet ready for your classroom. Open in Kuraplan to grab the print-ready PDF, customize it for your students, or generate a fresh version in seconds.
Interpreting Statistical Information
Part A: Transport to school
Read the statistical information below. Use the data and the context, not just the numbers, when writing your answers.
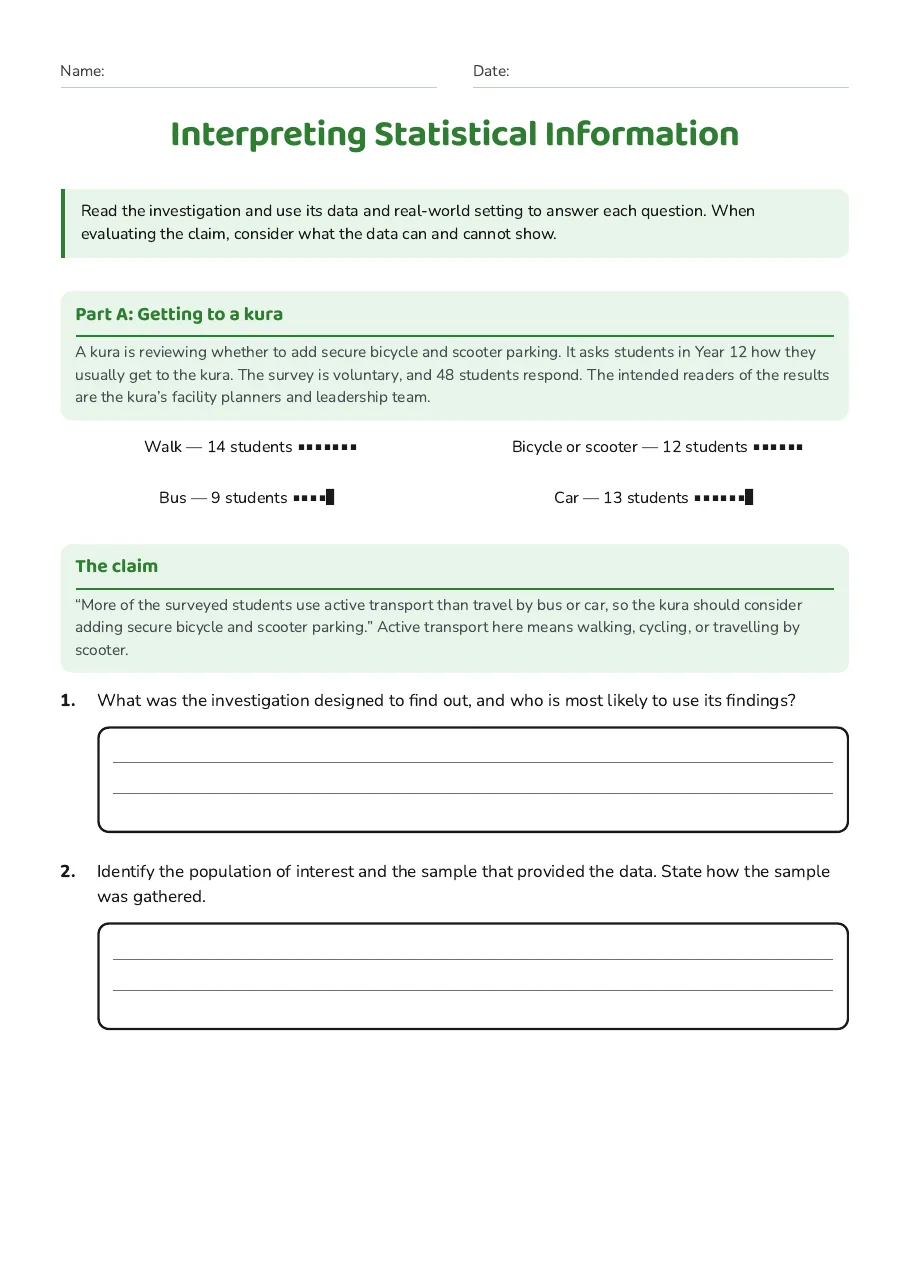
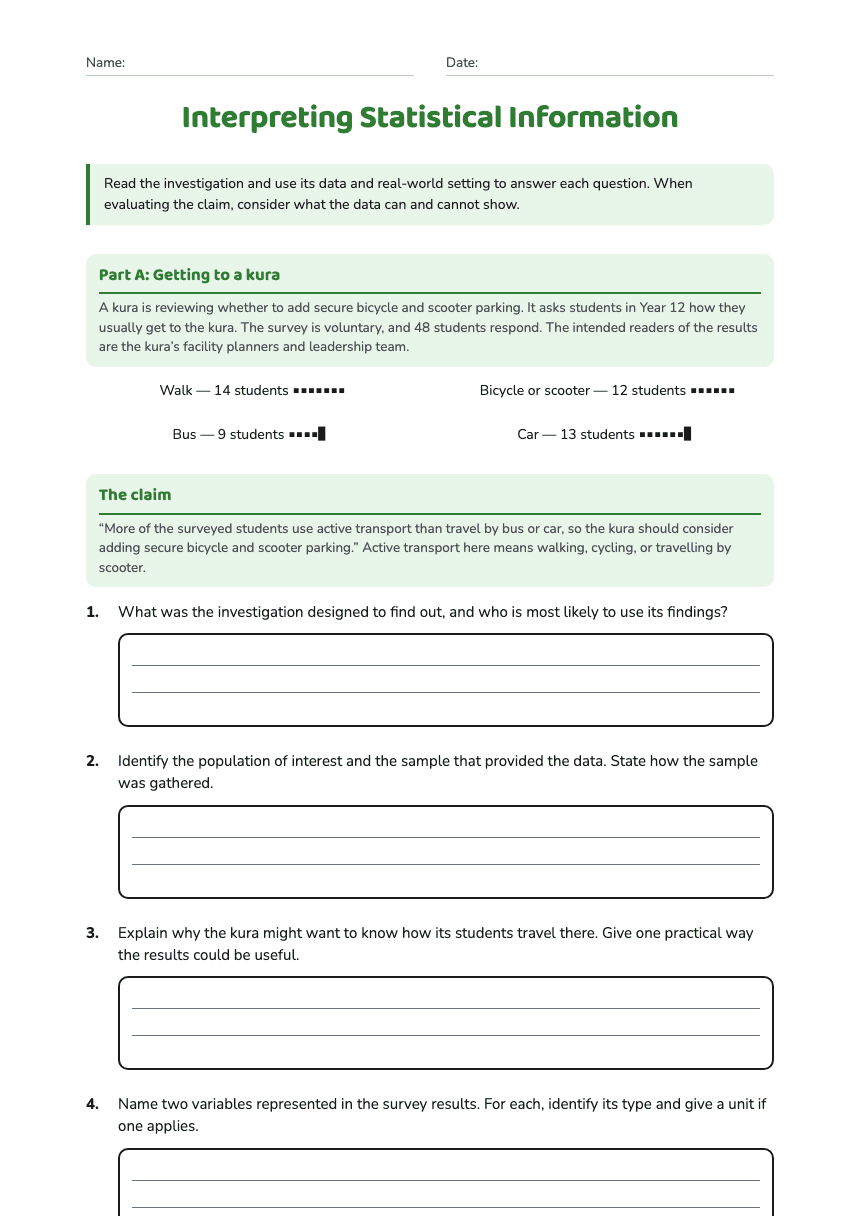
Investigation: A kura surveyed 40 Year 12 students about how they usually travelled to school. The kura is considering whether to improve facilities for active transport.
Data source: Voluntary survey of 40 Year 12 students at the kura.
Data table:
Usual transport mode Number of students
Walk 12
Bicycle or scooter 10
Bus 8
Car 10
Total 40
Simple graph: Each ■ represents 2 students.
Walk: ■■■■■■ 12
Bicycle or scooter: ■■■■■ 10
Bus: ■■■■ 8
Car: ■■■■■ 10
Claim: “More students use active transport than use a bus or car, so the kura should consider improving active-transport facilities.”
Vocabulary bank
Purpose: the reason for collecting or interpreting data. Context: the situation surrounding the data. Population: the whole group of interest. Sample: part of the population. Variable: a characteristic that can vary. Categorical: a variable recorded as groups or labels. Numerical: a variable recorded using numbers. Discrete: counted numerical values. Continuous: measured numerical values. Frequency: a count. Proportion: a part of the whole. Claim: a statement or conclusion. Evidence: data that supports or challenges a claim. Bias: a systematic influence that may make results less representative.
Part B: Individual exit check
Answer independently using the transport investigation above.
Answer Key
Answers may be worded differently, provided they use the data accurately and explain the context appropriately.
Answer: The purpose is to find out how Year 12 students usually travel to school and to use this information to help decide whether the kura should improve active-transport facilities. The intended audience is the kura's decision-makers, such as the school leadership, board, or staff involved in planning facilities. The findings may also be relevant to students, whānau, and the wider kura community.
Explanation: The purpose is identified from the investigation description: the kura is considering improvements to active transport. The audience is the group that could use the information to make that decision.
Answer: The population is the Year 12 students at the kura, or more specifically the Year 12 students whose transport habits the kura wants to understand. The sample is the 40 Year 12 students who completed the voluntary survey. The data source was a voluntary survey of these 40 students.
Explanation: The population is the whole group of interest. The sample is the smaller group from whom data was actually collected. Because participation was voluntary, the sample may not represent every Year 12 student equally well.
Answer: The kura is investigating how students travel to school because it is considering improving active-transport facilities. Knowing how many students walk, cycle, or use scooters can help the kura decide whether facilities such as bike or scooter storage, safer paths, covered areas, or changing facilities would be useful. The information could also support health, environmental, safety, and transport planning for students and whānau.
Explanation: Context means connecting the data to the real situation. The numbers are being collected to inform a practical decision, rather than simply to describe transport modes.
Answer:
• Usual transport mode: a categorical variable because the responses are labels or groups: walk, bicycle or scooter, bus, and car. It has no numerical unit.
• Number of students using each transport mode: a discrete numerical variable because students are counted in whole numbers. Its unit is students.
Explanation: A categorical variable places individuals into groups. A discrete numerical variable is a count, so values such as 12, 10, and 8 represent whole numbers of students.
Answer: The claim is: “More students use active transport than use a bus or car, so the kura should consider improving active-transport facilities.”
Calculation:
Active transport = walking + bicycle or scooter
12 + 10 = 22 students
Bus or car = bus + car
8 + 10 = 18 students
Therefore, 22 students use active transport compared with 18 who use a bus or car. The difference is:
22 − 18 = 4 students
As proportions of the 40 students:
Active transport: 22 ÷ 40 = 0.55 = 55%
Bus or car: 18 ÷ 40 = 0.45 = 45%
Any one of these comparisons is a relevant statistic supporting the claim.
Answer: The evidence answers the purpose partly. It shows how the 40 surveyed Year 12 students usually travel to school and allows the kura to compare active transport with bus or car use. The data shows that 22 of the 40 students, or 55%, use active transport, compared with 18 students, or 45%, who use a bus or car.
However, the evidence does not completely answer whether facilities should be improved. The survey was voluntary and included only 40 Year 12 students, so it may not represent all students at the kura. The data also does not show what facilities students need or whether improving them would be safe, affordable, and practical.
Answer: Useful missing information could include:
• transport information from students in all year levels, not only Year 12;
• the number of students who would use improved facilities;
• the locations and condition of current paths, bike racks, scooter storage, and changing facilities;
• safety concerns, traffic patterns, distance travelled, and weather conditions;
• the cost of possible improvements and available funding;
• reasons why students choose their current transport mode;
• whether the voluntary sample is representative of the wider kura community.
Explanation: The current data describes transport modes but does not measure demand for particular facilities, costs, safety, or the views of students who were not surveyed.
Answer: The purpose is to find out how Year 12 students usually travel to school and to help the kura decide whether to improve active-transport facilities.
Answer: Usual transport mode is a categorical variable with no unit. Number of students using each mode is a discrete numerical variable measured in students.
Answer: The kura surveyed 40 Year 12 students about how they usually travel to school because it is considering improving active-transport facilities. The results can help the kura plan facilities that meet the needs of students and the wider community.
Answer: Twenty-two of the 40 students use active transport: 12 walk and 10 use a bicycle or scooter. This is 22 ÷ 40 = 55%, which is greater than the 18 students, or 45%, who travel by bus or car.
About This Worksheet
Free in Kuraplan
Sign up free, grab the PDF, and customize it for your class.
Print-Ready
Formatted for standard paper. Clean layout, easy to read.
AI-Generated
Created with Kuraplan's AI, designed for real classroom use.
For Teachers & Parents
Use in classrooms, for homework, tutoring, or homeschool.
Need a custom version of this worksheet?
Kuraplan's AI generates custom worksheets in seconds — differentiated for every learner, aligned to your curriculum.
Generate Custom Worksheets — Free