MathsFreePrintable

Multivariate Data Investigation

A free maths worksheet ready for your classroom. Open in Kuraplan to grab the print-ready PDF, customize it for your students, or generate a fresh version in seconds.

Multivariate Data Investigation worksheet preview
Name:Date:

Multivariate Data Investigation

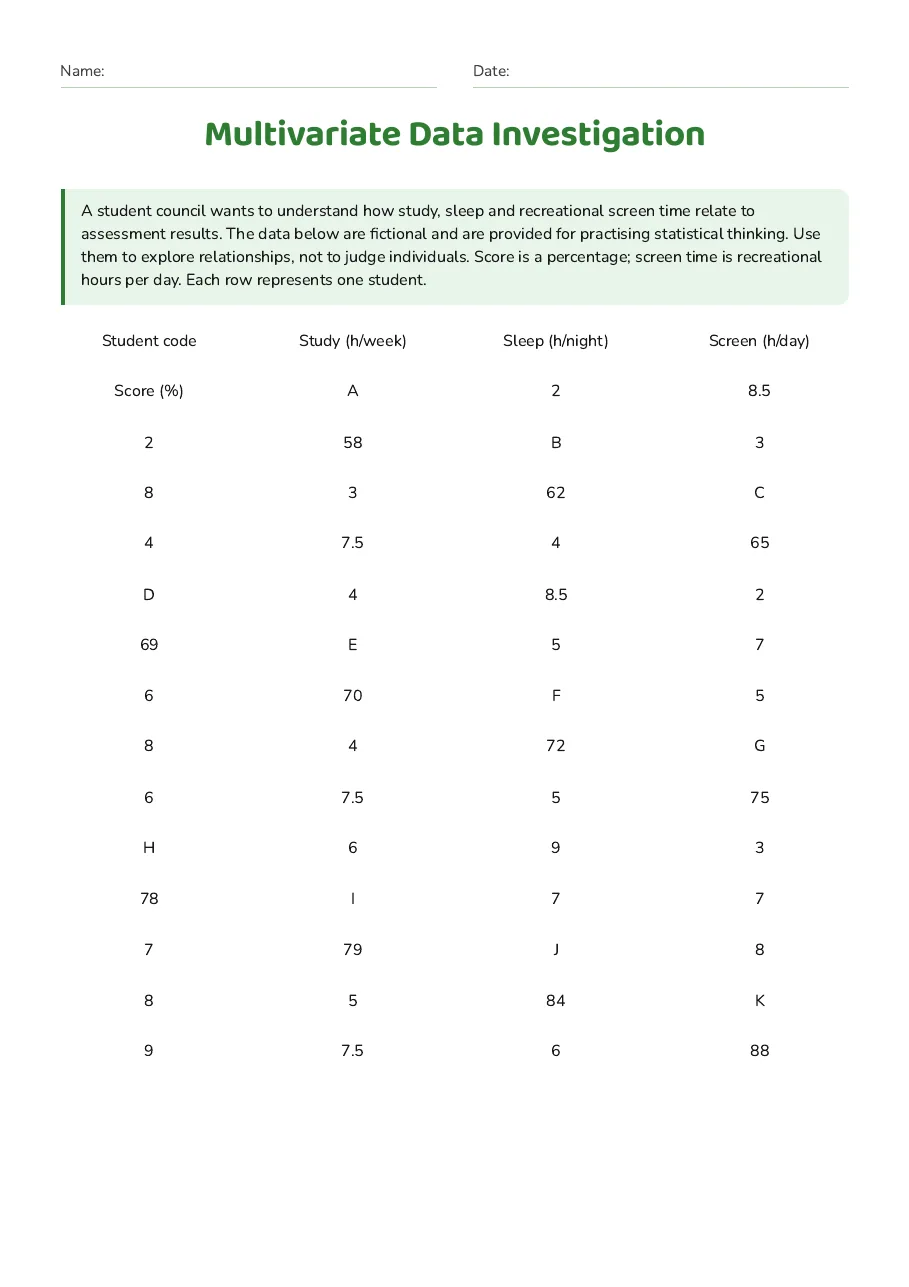
A student council wants to understand how study, sleep and recreational screen time relate to assessment results. The data below are fictional and are provided for practising statistical thinking. Use them to explore relationships, not to judge individuals. Score is a percentage; screen time is recreational hours per day. Each row represents one student.

Student code

Study (h/week)

Sleep (h/night)

Screen (h/day)

Score (%)

A

2

8.5

2

58

B

3

8

3

62

C

4

7.5

4

65

D

4

8.5

2

69

E

5

7

6

70

F

5

8

4

72

G

6

7.5

5

75

H

6

9

3

78

I

7

7

7

79

J

8

8

5

84

K

9

7.5

6

88

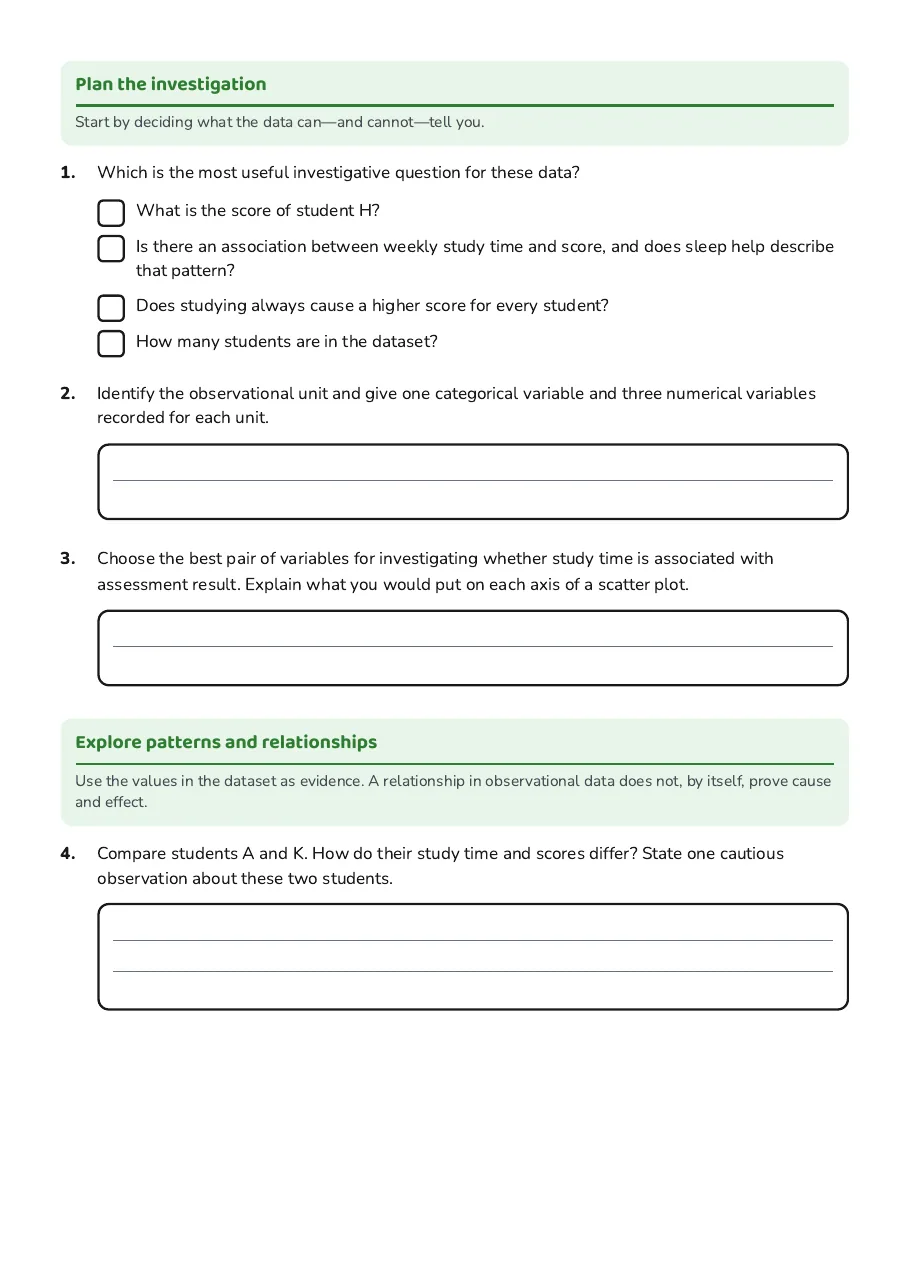
Plan the investigation

Start by deciding what the data can—and cannot—tell you.

1.Which is the most useful investigative question for these data?
  • What is the score of student H?
  • Is there an association between weekly study time and score, and does sleep help describe that pattern?
  • Does studying always cause a higher score for every student?
  • How many students are in the dataset?
2.Identify the observational unit and give one categorical variable and three numerical variables recorded for each unit.
3.Choose the best pair of variables for investigating whether study time is associated with assessment result. Explain what you would put on each axis of a scatter plot.

Explore patterns and relationships

Use the values in the dataset as evidence. A relationship in observational data does not, by itself, prove cause and effect.

4.Compare students A and K. How do their study time and scores differ? State one cautious observation about these two students.
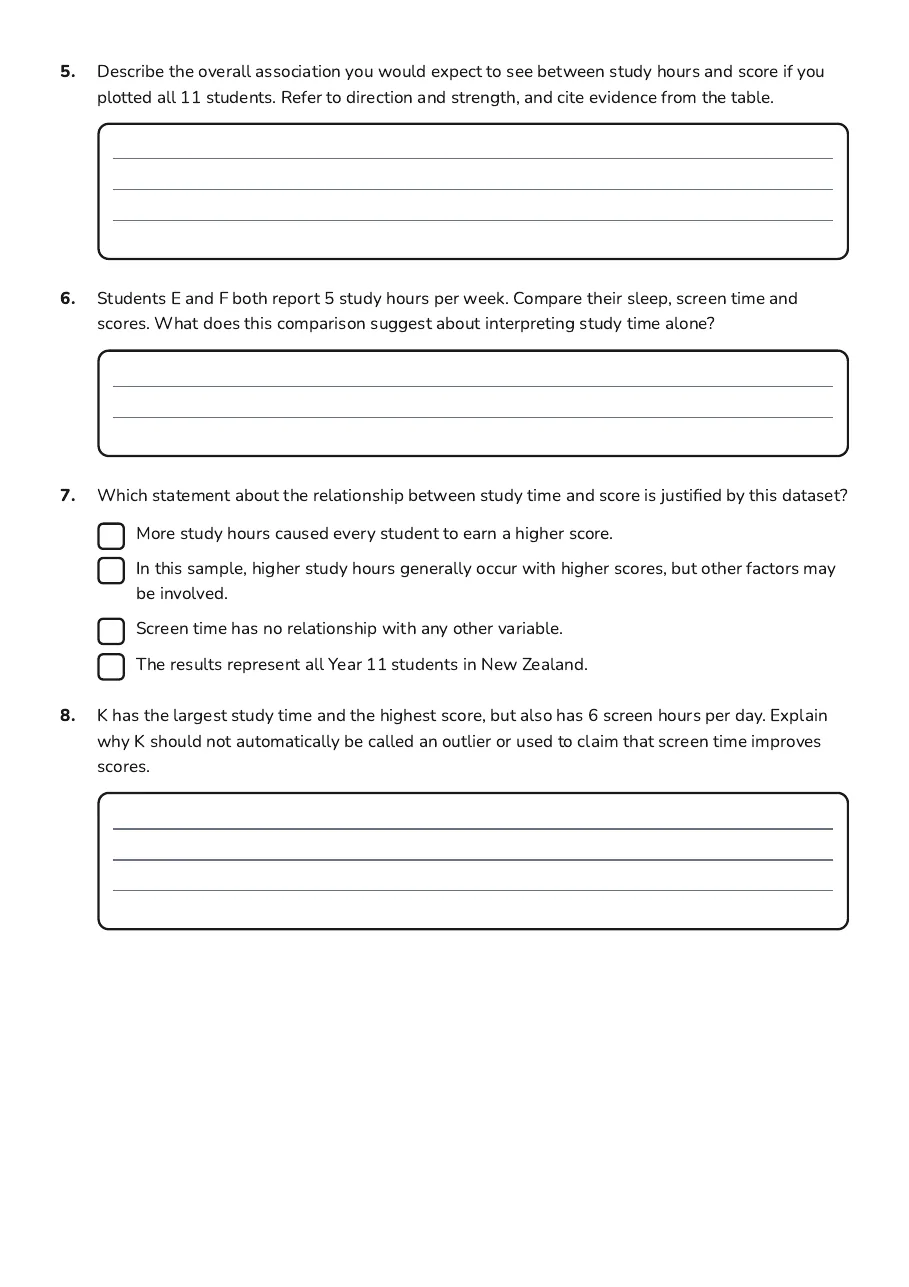
5.Describe the overall association you would expect to see between study hours and score if you plotted all 11 students. Refer to direction and strength, and cite evidence from the table.
6.Students E and F both report 5 study hours per week. Compare their sleep, screen time and scores. What does this comparison suggest about interpreting study time alone?
7.Which statement about the relationship between study time and score is justified by this dataset?
  • More study hours caused every student to earn a higher score.
  • In this sample, higher study hours generally occur with higher scores, but other factors may be involved.
  • Screen time has no relationship with any other variable.
  • The results represent all Year 11 students in New Zealand.
8.K has the largest study time and the highest score, but also has 6 screen hours per day. Explain why K should not automatically be called an outlier or used to claim that screen time improves scores.

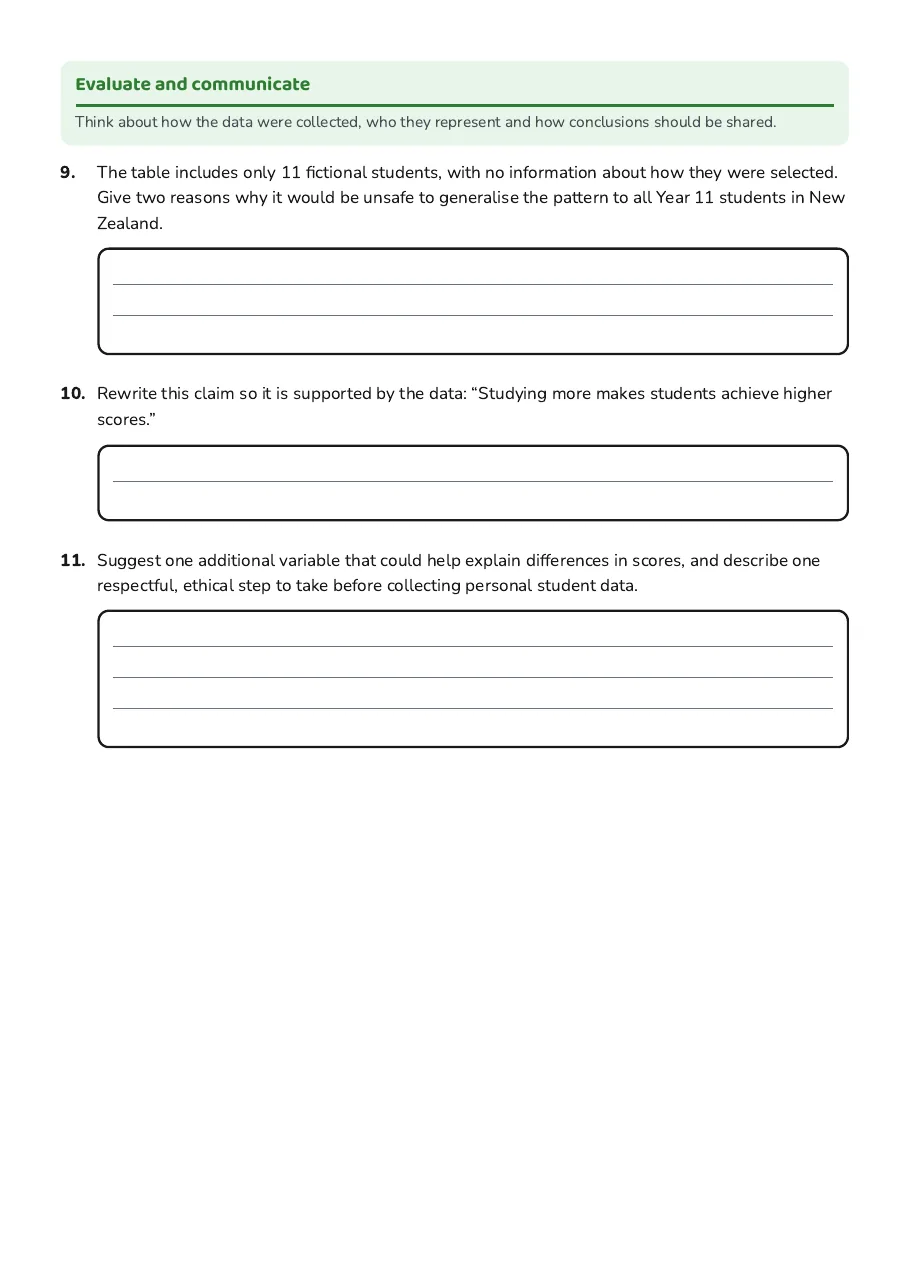
Evaluate and communicate

Think about how the data were collected, who they represent and how conclusions should be shared.

9.The table includes only 11 fictional students, with no information about how they were selected. Give two reasons why it would be unsafe to generalise the pattern to all Year 11 students in New Zealand.
10.Rewrite this claim so it is supported by the data: “Studying more makes students achieve higher scores.”
11.Suggest one additional variable that could help explain differences in scores, and describe one respectful, ethical step to take before collecting personal student data.

4 printable pages

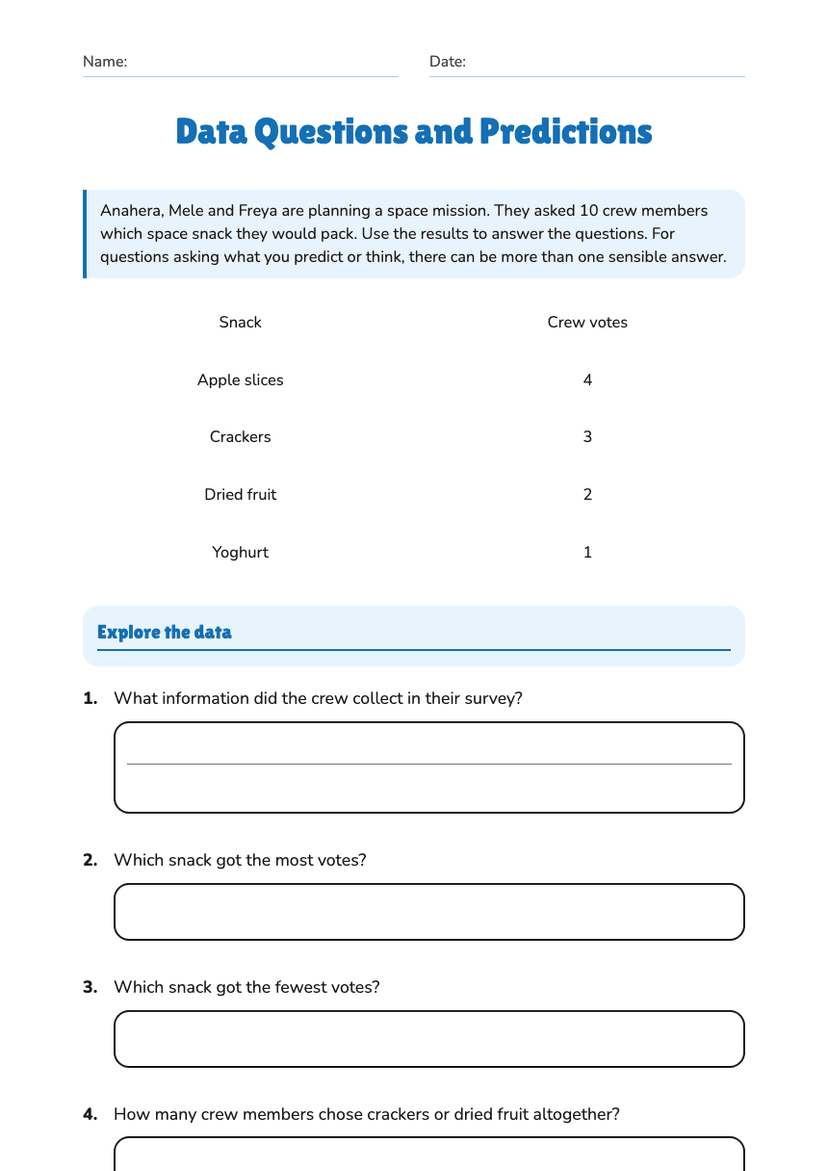
  • Multivariate Data Investigation, page 1 of 4: A student council wants to understand how study, sleep and recreational screen time…

    Page 1

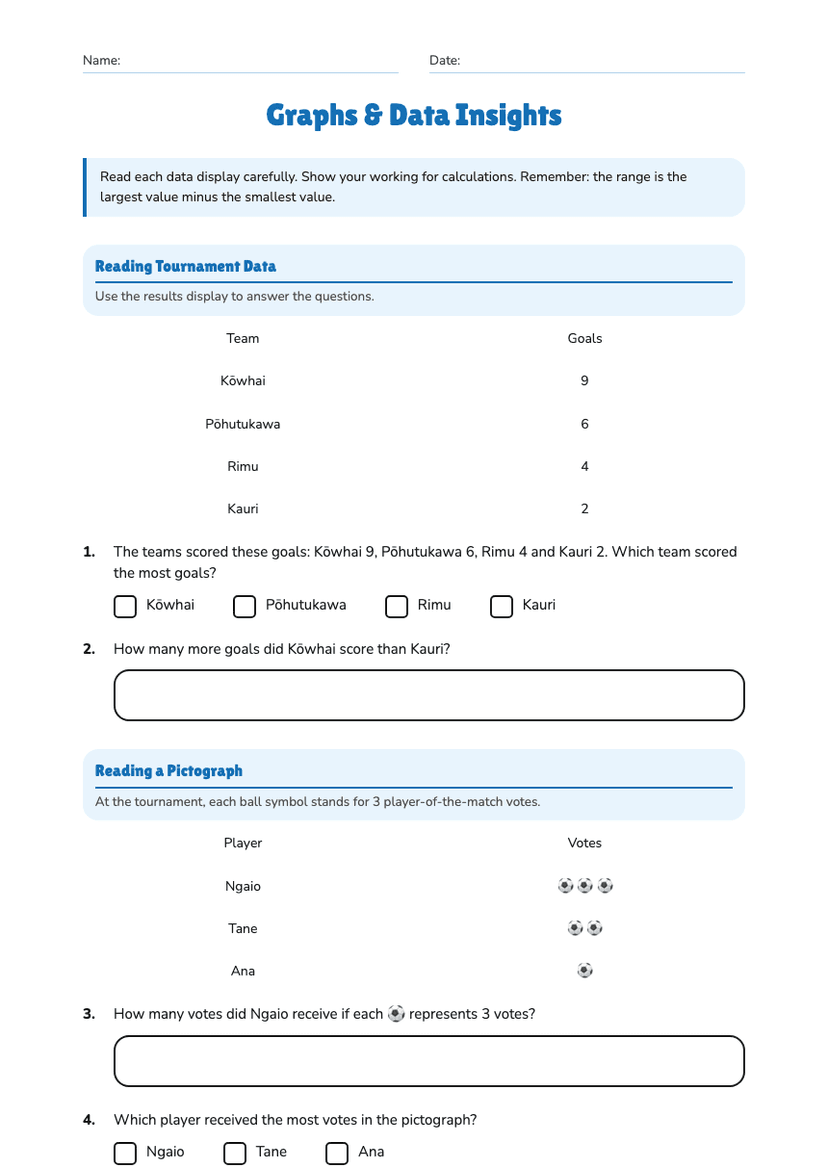
  • Multivariate Data Investigation, page 2 of 4: Plan the investigation, Explore patterns and relationships

    Page 2

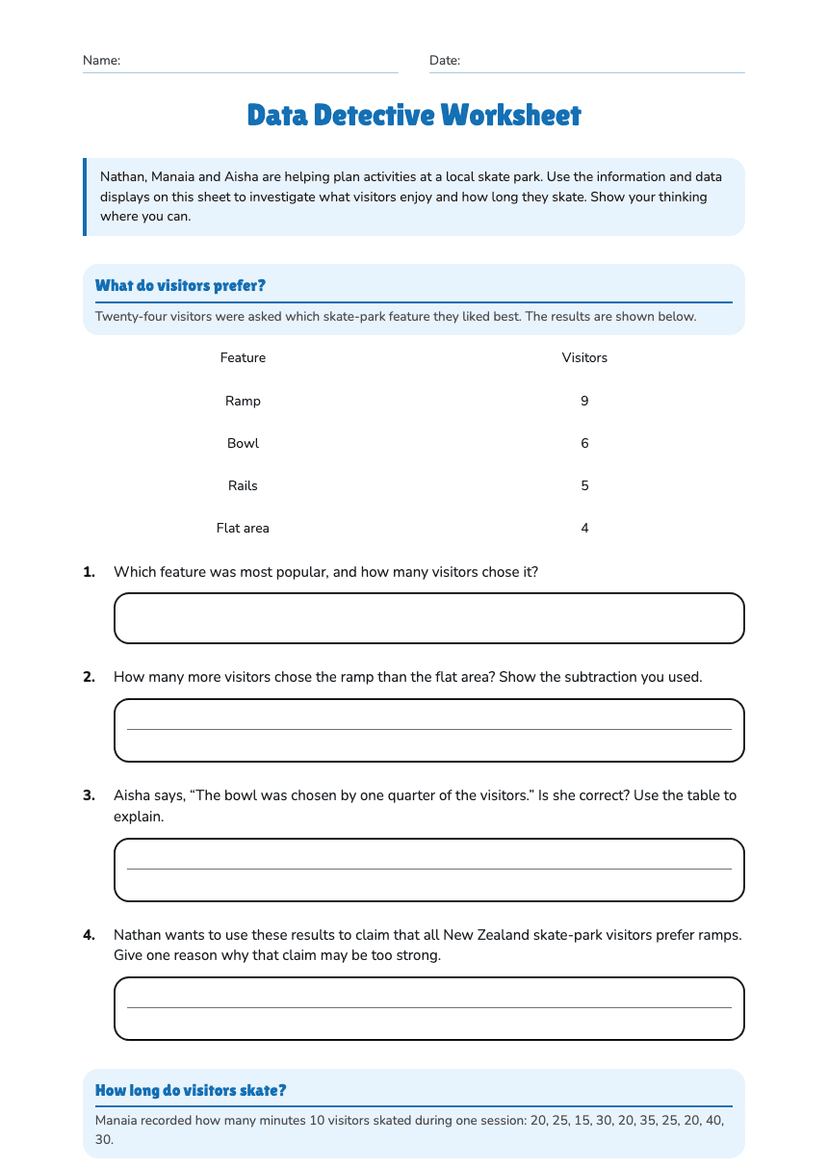
  • Multivariate Data Investigation, page 3 of 4: 5. Describe the overall association you would expect to see between study hours and score…

    Page 3

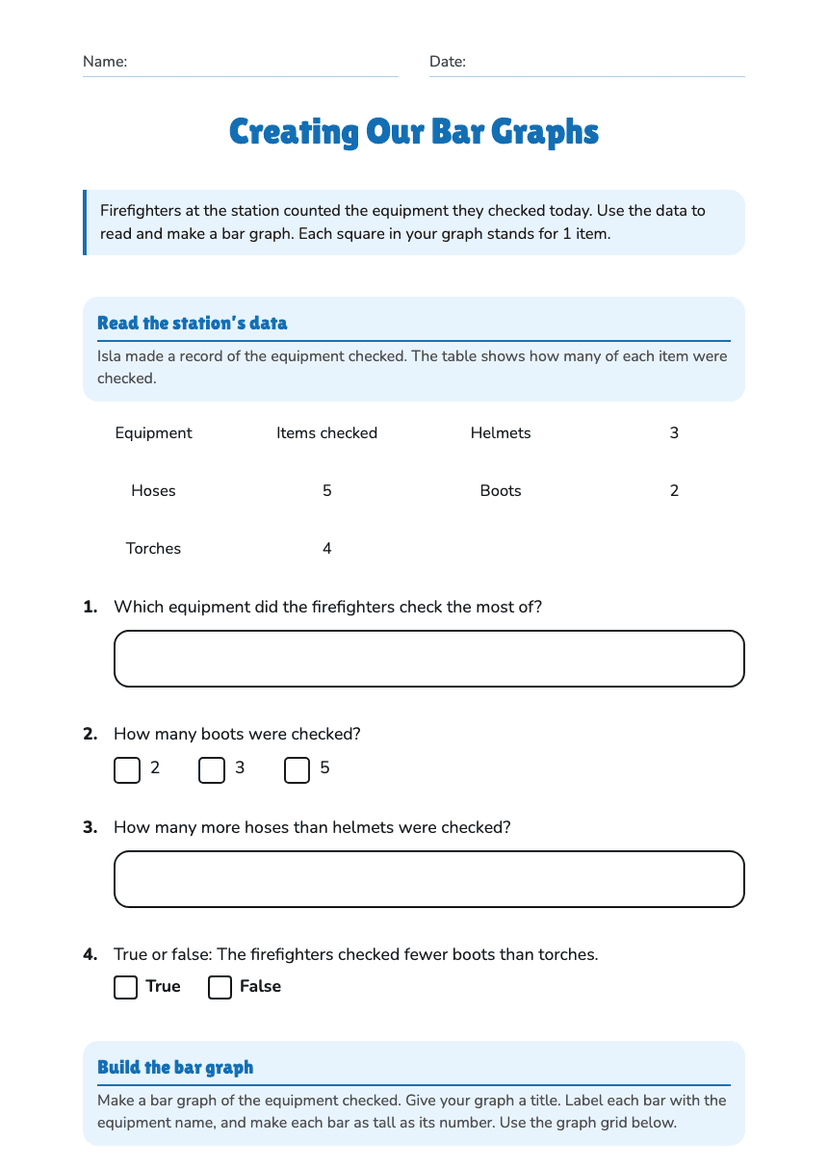
  • Multivariate Data Investigation, page 4 of 4: Evaluate and communicate

    Page 4

About This Worksheet

Free in Kuraplan

Sign up free, grab the PDF, and customize it for your class.

Print-Ready

Formatted for standard paper. Clean layout, easy to read.

AI-Generated

Created with Kuraplan's AI, designed for real classroom use.

For Teachers & Parents

Use in classrooms, for homework, tutoring, or homeschool.

Need a custom version of this worksheet?

Kuraplan's AI generates custom worksheets in seconds — differentiated for every learner, aligned to your curriculum.

Generate Custom Worksheets — Free
No credit card Curriculum-aligned Under 60 seconds