Multivariate Statistics Investigation Worksheet
A free maths worksheet ready for your classroom. Open in Kuraplan to grab the print-ready PDF, customize it for your students, or generate a fresh version in seconds.
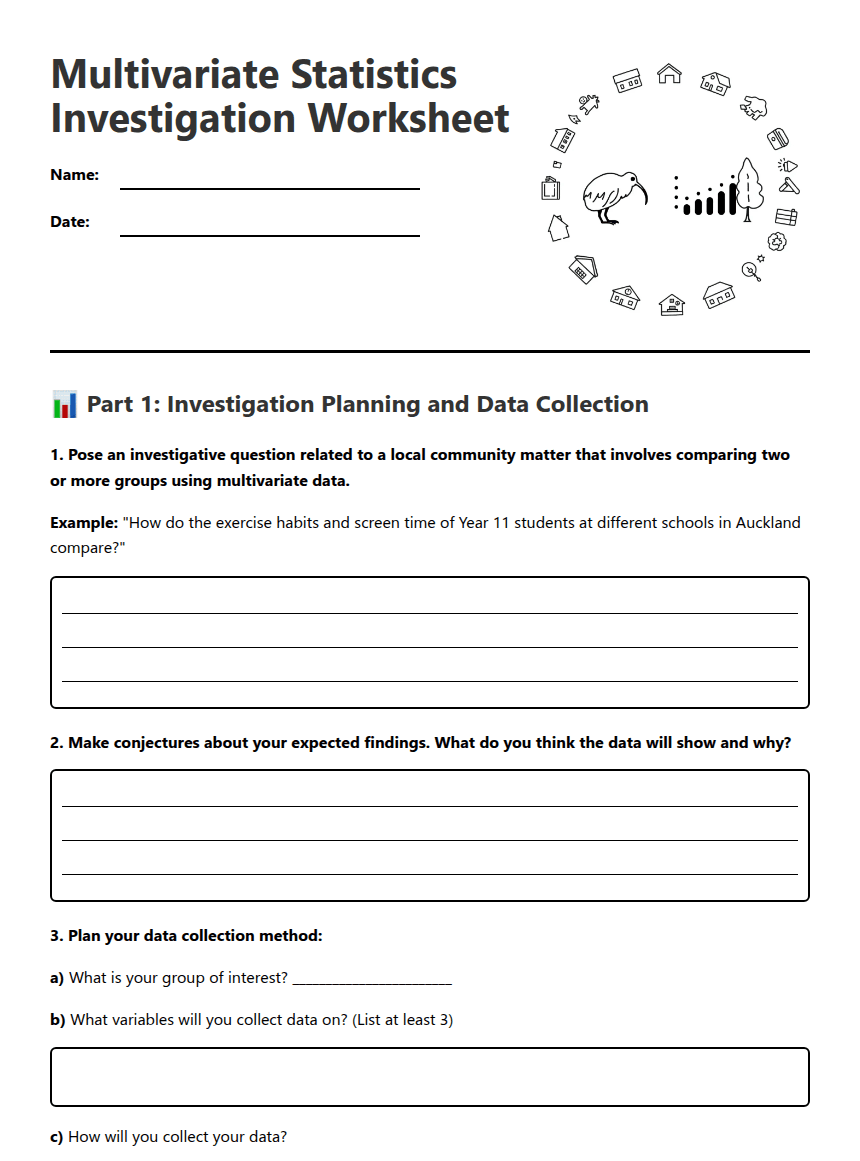
Multivariate Statistics Investigation Worksheet

📊 Part 1: Investigation Planning and Data Collection
Example: "How do the exercise habits and screen time of Year 11 students at different schools in Auckland compare?"
a) What is your group of interest? ________________________
b) What variables will you collect data on? (List at least 3)
c) How will you collect your data?
📈 Part 2: Data Analysis and Visualisation
Required visualisations: Tick when completed
a) Median values for each group: ________________________________
b) Mode(s) observed: ___________________________________________
c) Range for each variable: ___________________________________
d) Describe any clusters, outliers, or trends you observe:
🎯 Part 3: Communication and Reflection
a) What limitations did your data collection method have?
b) What sources of variation might have affected your results?
c) How could you improve this investigation if you were to repeat it?
Justify your rating: _________________________________________________
About This Worksheet
Free in Kuraplan
Sign up free, grab the PDF, and customize it for your class.
Print-Ready
Formatted for standard paper. Clean layout, easy to read.
AI-Generated
Created with Kuraplan's AI, designed for real classroom use.
For Teachers & Parents
Use in classrooms, for homework, tutoring, or homeschool.
Need a custom version of this worksheet?
Kuraplan's AI generates custom worksheets in seconds — differentiated for every learner, aligned to your curriculum.
Generate Custom Worksheets — Free






