MathsFreePrintable

Pie and Bar Graphs

A free maths worksheet ready for your classroom. Open in Kuraplan to grab the print-ready PDF, customize it for your students, or generate a fresh version in seconds.
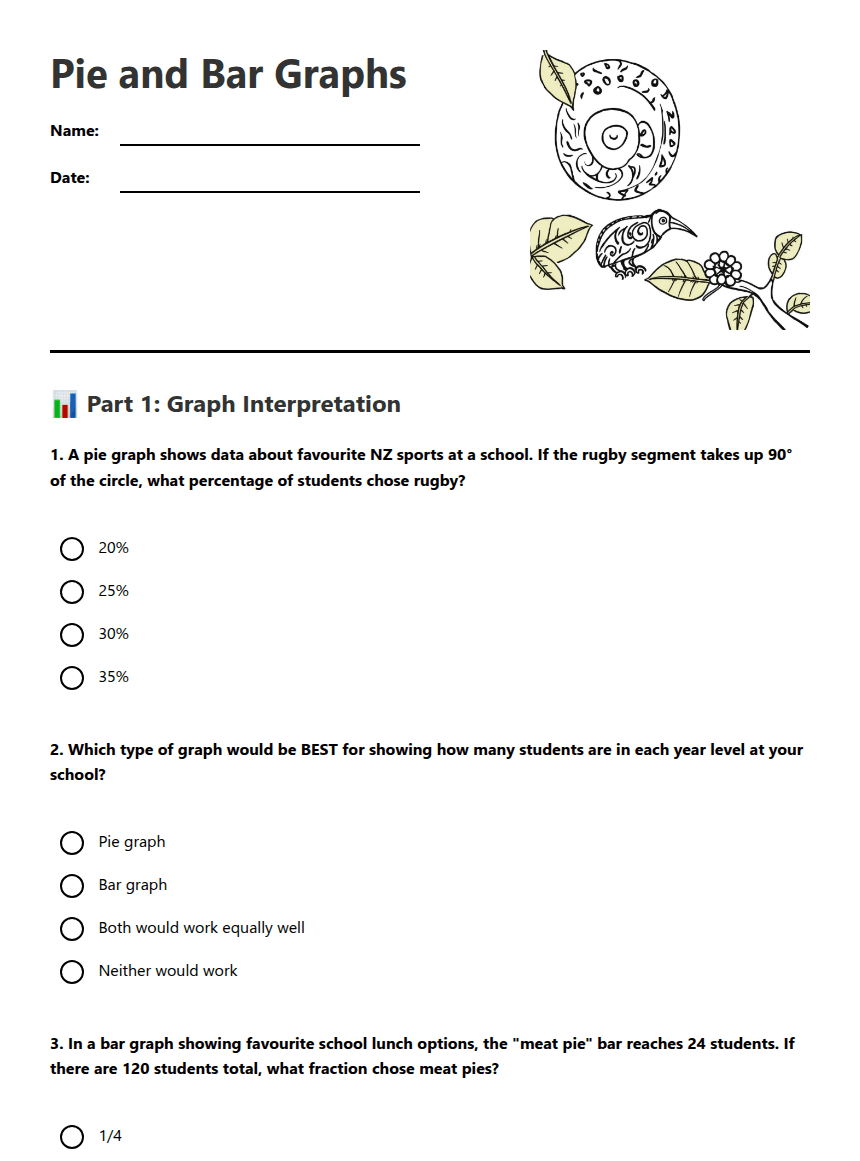
Pie and Bar Graphs worksheet preview

Pie and Bar Graphs

Pie and bar graph illustration

📊 Part 1: Graph Interpretation

1. A pie graph shows data about favourite NZ sports at a school. If the rugby segment takes up 90° of the circle, what percentage of students chose rugby?

20%

25%

30%

35%

2. Which type of graph would be BEST for showing how many students are in each year level at your school?

Pie graph

Bar graph

Both would work equally well

Neither would work

3. In a bar graph showing favourite school lunch options, the "meat pie" bar reaches 24 students. If there are 120 students total, what fraction chose meat pies?

1/4

1/5

1/6

1/3

4. Which features make a graph misleading? (Check all that apply)

Starting the scale at zero

Using different colours for each category

Having uneven scale intervals

Missing labels on axes

📈 Part 2: Creating Graphs

5. A survey of 60 Year 10 students asked about their favourite weekend activities in NZ. The results were: Beach (15), Hiking (12), Shopping (18), Gaming (9), Sports (6). Calculate the angle for each segment in a pie graph:

Beach: ______°

Hiking: ______°

Shopping: ______°

Gaming: ______°

Sports: ______°

6. Draw a simple bar graph for the weekend activities data above. Include proper labels and scale.
7. Complete this statement about the data: "The most popular weekend activity was __________, chosen by ____% of students, while the least popular was __________ with only ____% of responses."

🤔 Part 3: Critical Analysis

8. A local council wants to show that most residents support a new park. They create a pie graph where the "support" segment looks much larger than it should. What might they have done wrong, and how could this mislead people?
9. You're creating a bar graph showing temperatures in different NZ cities. The temperatures are: Auckland 22°C, Wellington 18°C, Christchurch 16°C, Dunedin 14°C. Should your scale start at 0°C or 10°C? Explain your reasoning.
10. Write three mathematical vocabulary words you learned about graphs today and define each one:

1. ________________: _________________________________

2. ________________: _________________________________

3. ________________: _________________________________

About This Worksheet

Free in Kuraplan

Sign up free, grab the PDF, and customize it for your class.

Print-Ready

Formatted for standard paper. Clean layout, easy to read.

AI-Generated

Created with Kuraplan's AI, designed for real classroom use.

For Teachers & Parents

Use in classrooms, for homework, tutoring, or homeschool.

Need a custom version of this worksheet?

Kuraplan's AI generates custom worksheets in seconds — differentiated for every learner, aligned to your curriculum.

Generate Custom Worksheets — Free


No credit card Curriculum-aligned Under 60 seconds





