MathsFreePrintable

Pie and Bar Graphs

A free maths worksheet ready for your classroom. Open in Kuraplan to grab the print-ready PDF, customize it for your students, or generate a fresh version in seconds.
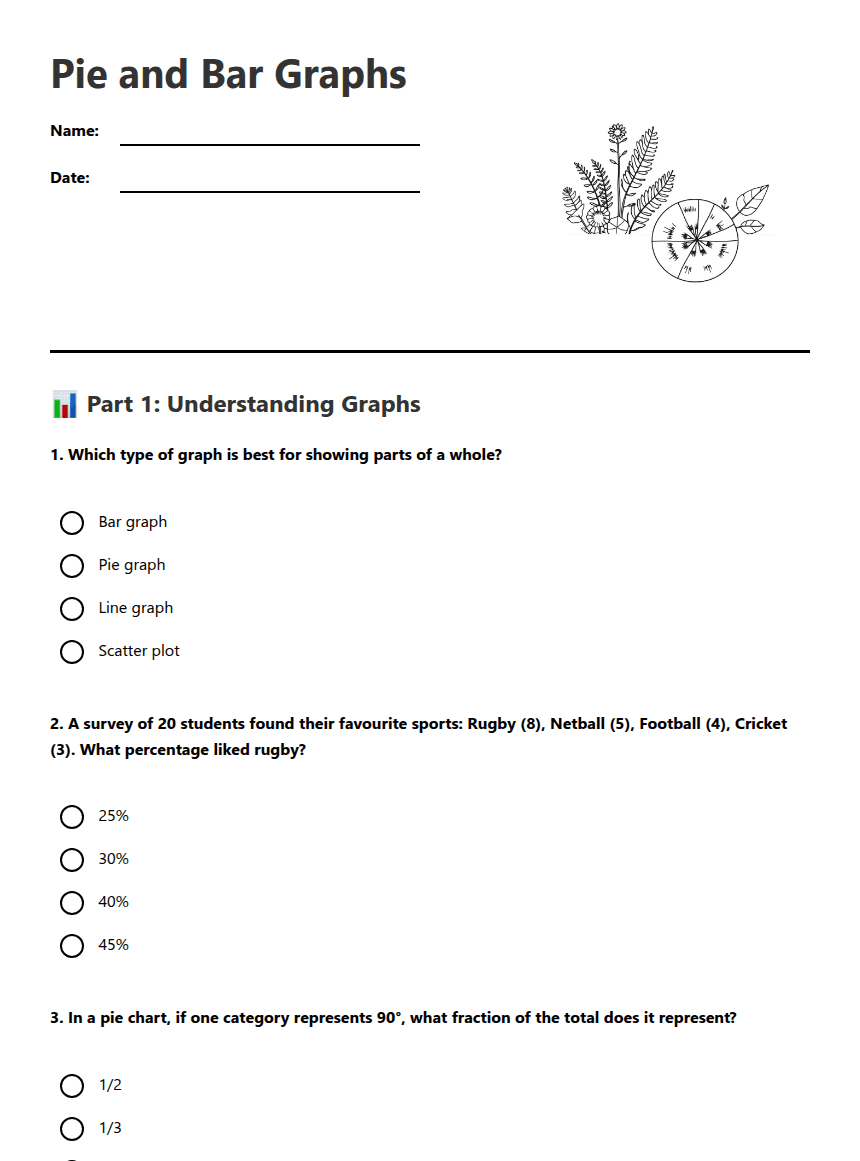
Pie and Bar Graphs worksheet preview
Pie and Bar Graphs

Pie and bar graph illustration

📊 Part 1: Understanding Graphs

1. Which type of graph is best for showing parts of a whole?

Bar graph

Pie graph

Line graph

Scatter plot

2. A survey of 20 students found their favourite sports: Rugby (8), Netball (5), Football (4), Cricket (3). What percentage liked rugby?

25%

30%

40%

45%

3. In a pie chart, if one category represents 90°, what fraction of the total does it represent?

1/2

1/3

1/4

1/6

4. Which features should every good bar graph include? (Select all that apply)

Title

Labelled axes

Equal bar widths

Bright colours

Scale starting from zero

📈 Part 2: Creating and Interpreting Graphs

5. A class collected data on favourite lunch foods: Sandwiches (12), Sushi (6), Pies (8), Salad (4). Calculate the angle for each category in a pie chart.

Sandwiches: ______°     Sushi: ______°     Pies: ______°     Salad: ______°

6. Draw a bar graph for the lunch food data above. Include a title, labels, and appropriate scale.
7. Look at this scenario: A graph shows that 60% of students walk to school, but the pie slice for walking looks much larger than 60%. What might be wrong with this graph?
8. A bar graph shows mobile phone brands with these frequencies: Apple (45), Samsung (30), Other (15). The Apple bar starts at 25 instead of 0 on the y-axis. Explain why this is misleading.

🔍 Part 3: Real-World Analysis

9. A survey asked 100 New Zealand teenagers about their favourite weekend activities: Gaming (35), Sports (25), Shopping (20), Movies (12), Reading (8). Using this data, answer the following:

a) Which activity is most popular? _______________

b) What percentage of teenagers prefer sports? ______%

c) How many more teenagers like gaming than movies? ______

d) If you combined sports and reading, would it be more or less popular than gaming? _______________

10. Write a paragraph communicating the key findings from the weekend activities survey. Include specific data evidence and suggest one possible reason for the most popular choice.
11. You want to survey your school about favourite subjects to create a pie chart. List three important considerations to ensure your data collection and graph are accurate and not misleading.

1. _________________________________________________

2. _________________________________________________

3. _________________________________________________

About This Worksheet

Free in Kuraplan

Sign up free, grab the PDF, and customize it for your class.

Print-Ready

Formatted for standard paper. Clean layout, easy to read.

AI-Generated

Created with Kuraplan's AI, designed for real classroom use.

For Teachers & Parents

Use in classrooms, for homework, tutoring, or homeschool.

Need a custom version of this worksheet?

Kuraplan's AI generates custom worksheets in seconds — differentiated for every learner, aligned to your curriculum.

Generate Custom Worksheets — Free


No credit card Curriculum-aligned Under 60 seconds





