MathsFreePrintable
Pāngarau: Kauwhata Pae and Data Analysis
A free maths worksheet ready for your classroom. Open in Kuraplan to grab the print-ready PDF, customize it for your students, or generate a fresh version in seconds.
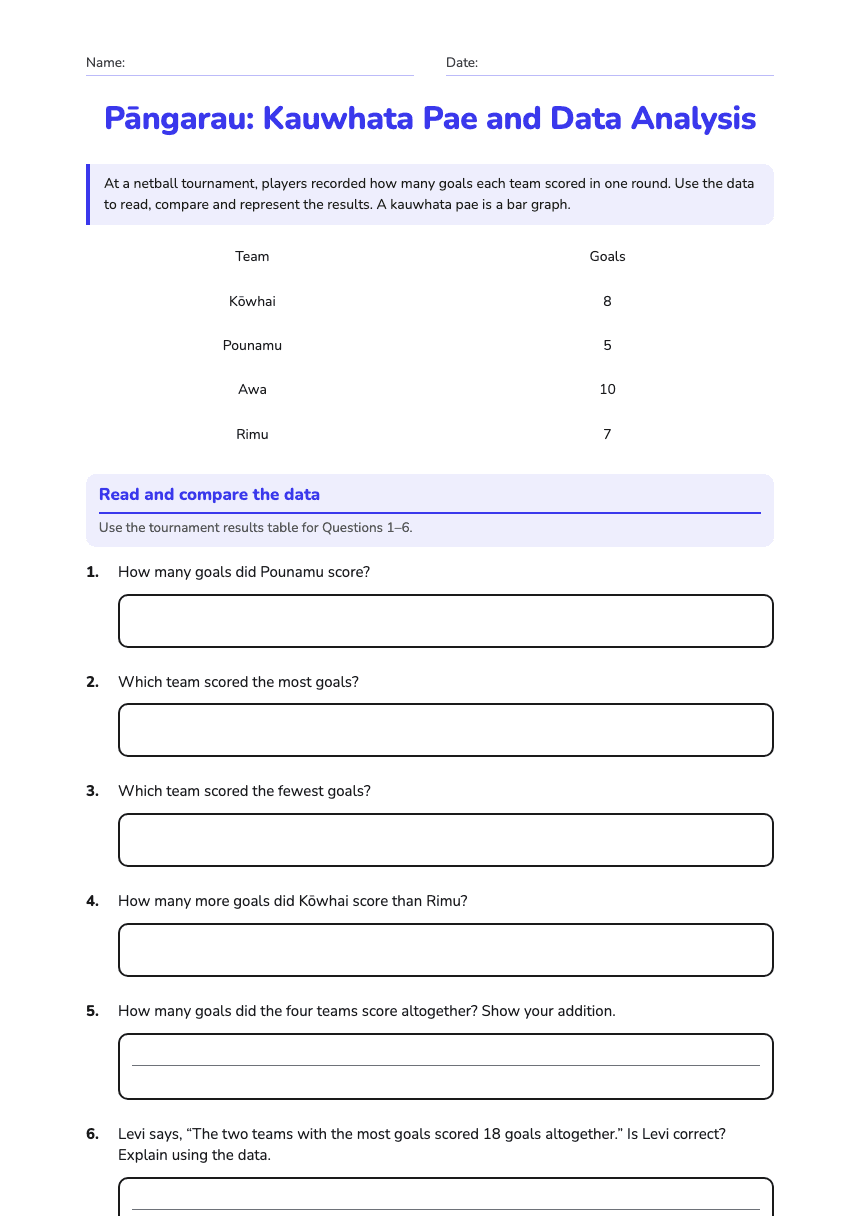
Name:Date:
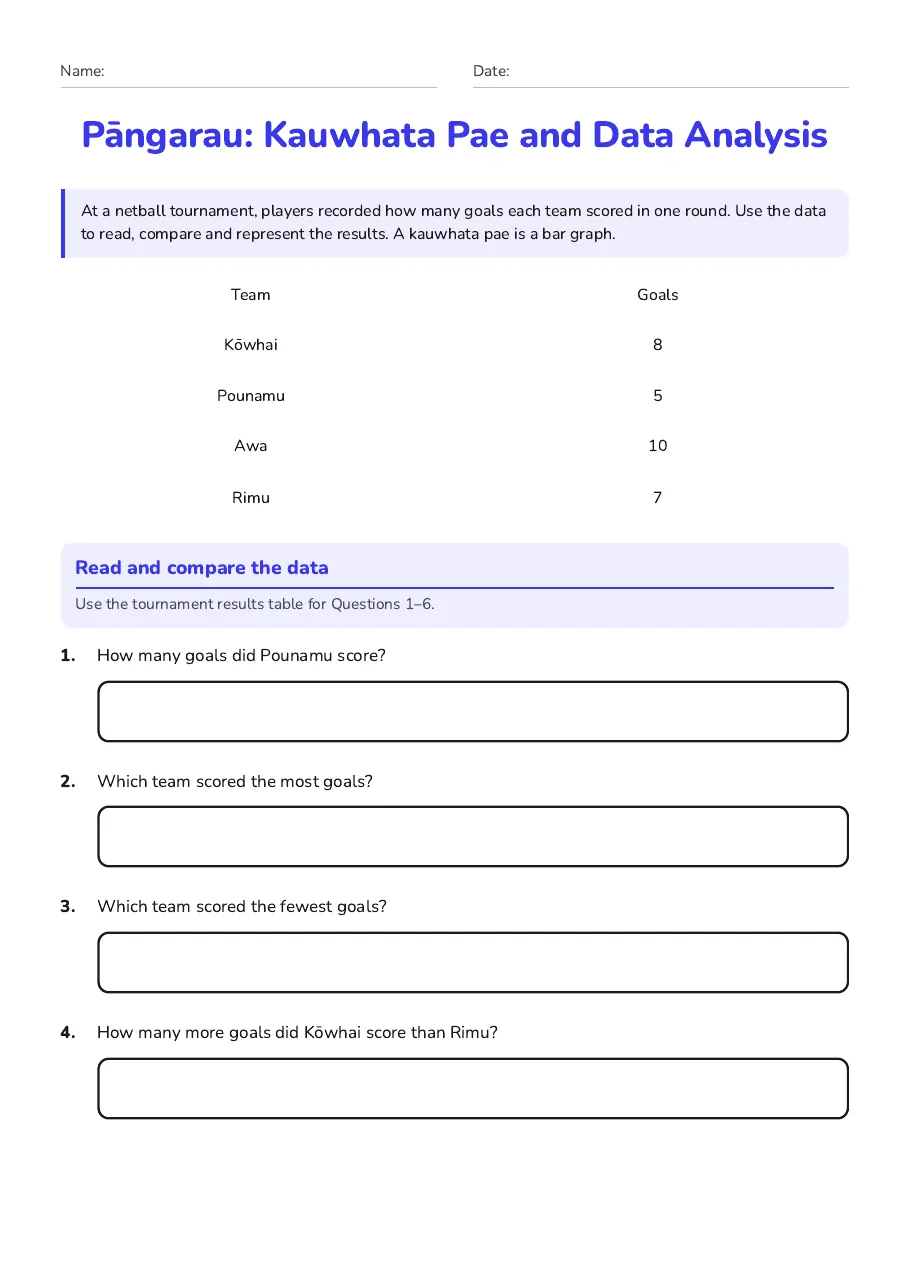
Pāngarau: Kauwhata Pae and Data Analysis
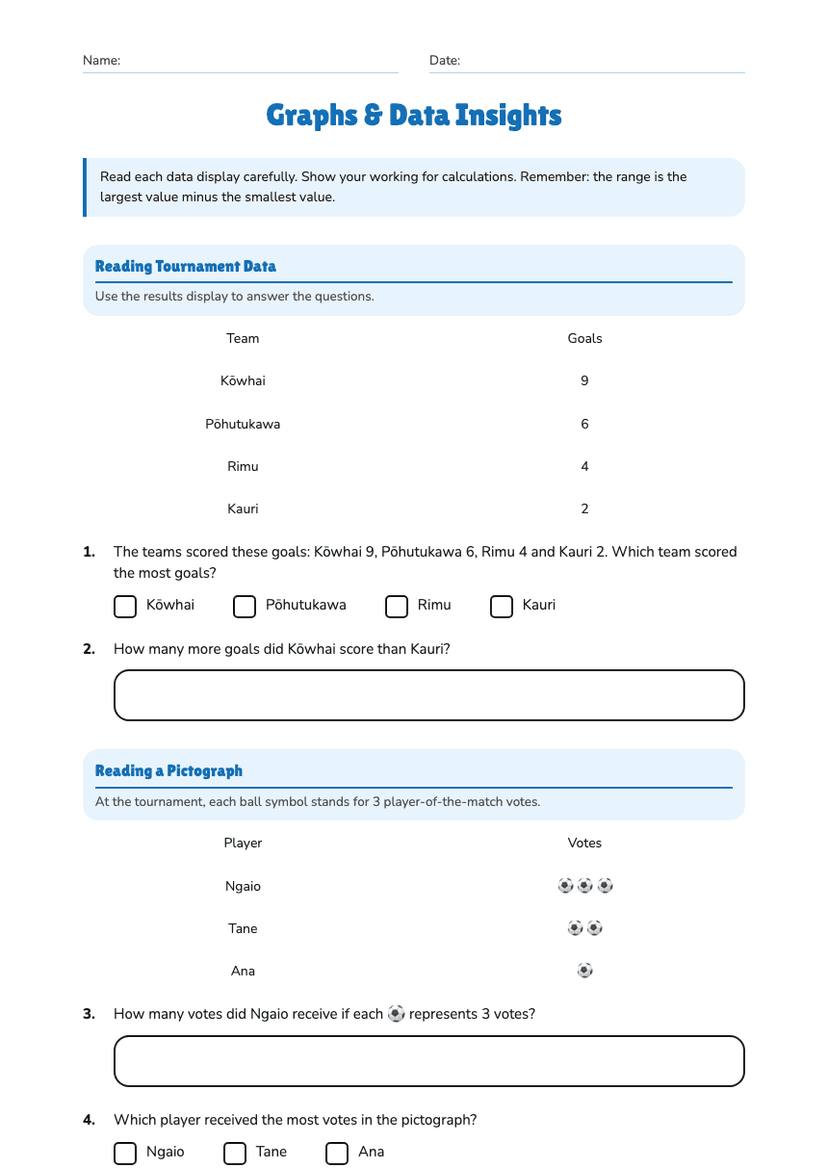
At a netball tournament, players recorded how many goals each team scored in one round. Use the data to read, compare and represent the results. A kauwhata pae is a bar graph.
Team
Goals
Kōwhai
8
Pounamu
5
Awa
10
Rimu
7
Read and compare the data
Use the tournament results table for Questions 1–6.
1.How many goals did Pounamu score?
2.Which team scored the most goals?
3.Which team scored the fewest goals?
4.How many more goals did Kōwhai score than Rimu?
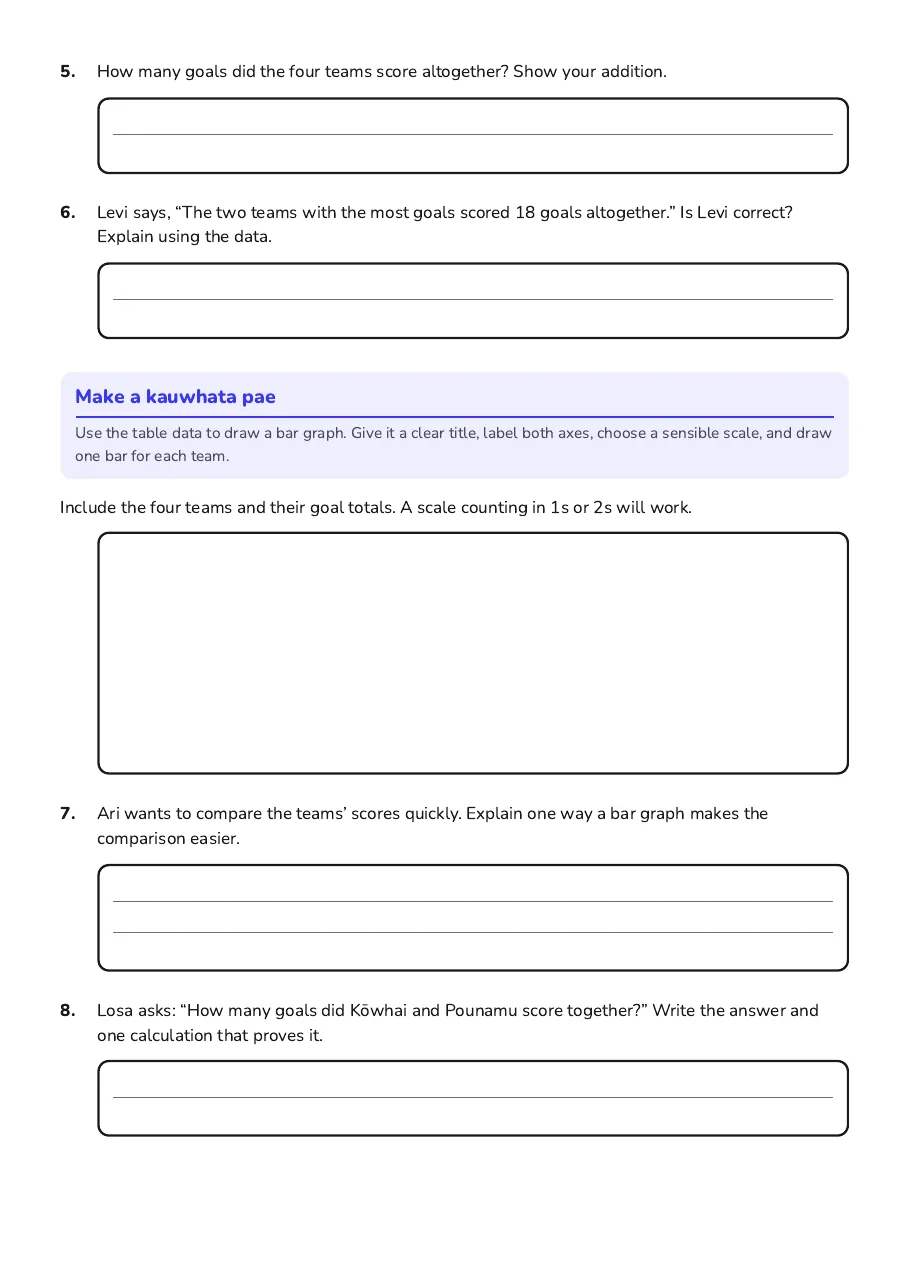
5.How many goals did the four teams score altogether? Show your addition.
6.Levi says, “The two teams with the most goals scored 18 goals altogether.” Is Levi correct? Explain using the data.
Make a kauwhata pae
Use the table data to draw a bar graph. Give it a clear title, label both axes, choose a sensible scale, and draw one bar for each team.
Include the four teams and their goal totals. A scale counting in 1s or 2s will work.
7.Ari wants to compare the teams’ scores quickly. Explain one way a bar graph makes the comparison easier.
8.Losa asks: “How many goals did Kōwhai and Pounamu score together?” Write the answer and one calculation that proves it.
2 printable pages
Page 1
Page 2
About This Worksheet
Free in Kuraplan
Sign up free, grab the PDF, and customize it for your class.
Print-Ready
Formatted for standard paper. Clean layout, easy to read.
AI-Generated
Created with Kuraplan's AI, designed for real classroom use.
For Teachers & Parents
Use in classrooms, for homework, tutoring, or homeschool.
Need a custom version of this worksheet?
Kuraplan's AI generates custom worksheets in seconds — differentiated for every learner, aligned to your curriculum.
Generate Custom Worksheets — Free No credit card Curriculum-aligned Under 60 seconds